As a frontend project, facebook/memlab has picked up 5.0k stars on GitHub (TypeScript). A framework for finding JavaScript memory leaks and analyzing heap snapshots
Snapshot summary built from the project's own GitHub metadata — there's no written TopGit review yet. The page will update automatically when a full review is published.
WHY NO REVIEW YET
TopGit writes full reviews for the most-starred, most-requested repositories. This page is a snapshot until then — see the READ ME tab for the original README in full.
memlab is an end-to-end testing and analysis framework for identifying
JavaScript memory leaks and optimization opportunities.
Online Resources: [Website and Demo] | [Documentation] | [Meta Engineering Blog Post] | [AI Assistant Guide]
Features:
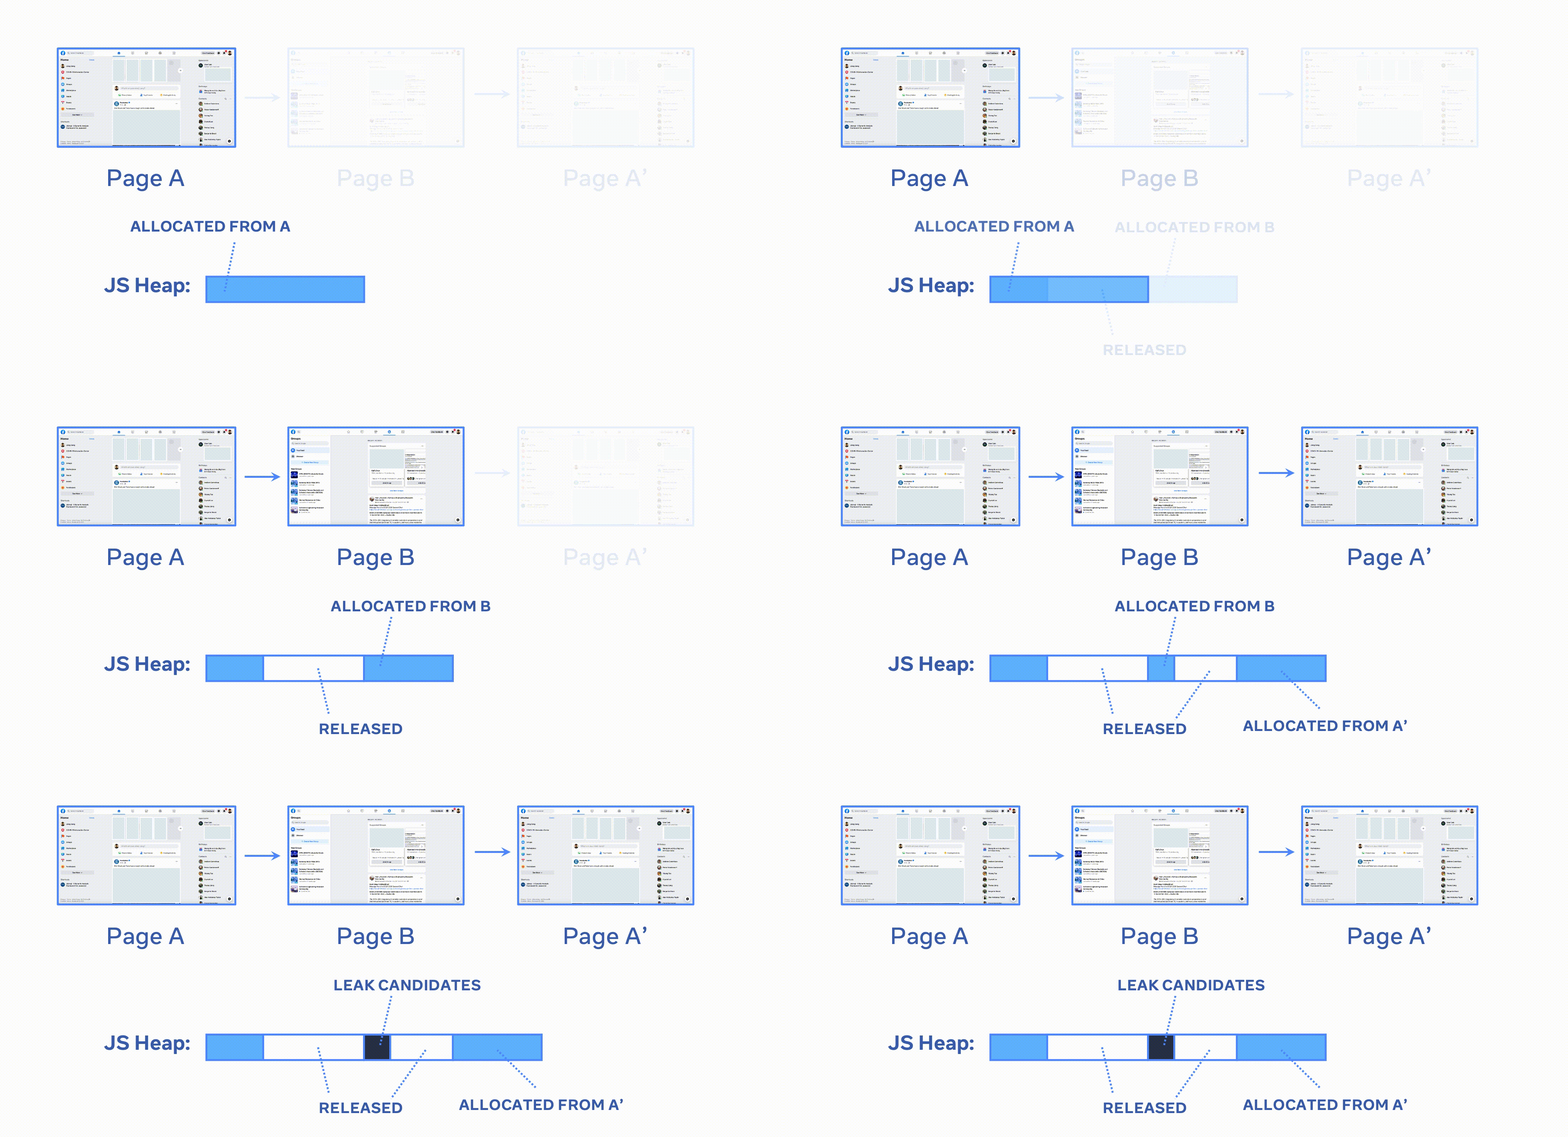
Browser memory leak detection - Write test scenarios with the Puppeteer
API, and memlab will automatically compare JavaScript heap snapshots, filter
out memory leaks, and aggregate the results
Object-oriented heap traversal API - Supports the creation of
custom memory leak detectors, and enables programmatic analysis of JS heap
snapshots taken from Chromium-based browsers, Node.js, Electron.js, and Hermes
Memory CLI toolbox - Built-in toolbox and APIs for finding memory
optimization opportunities (not necessarily just memory leaks)
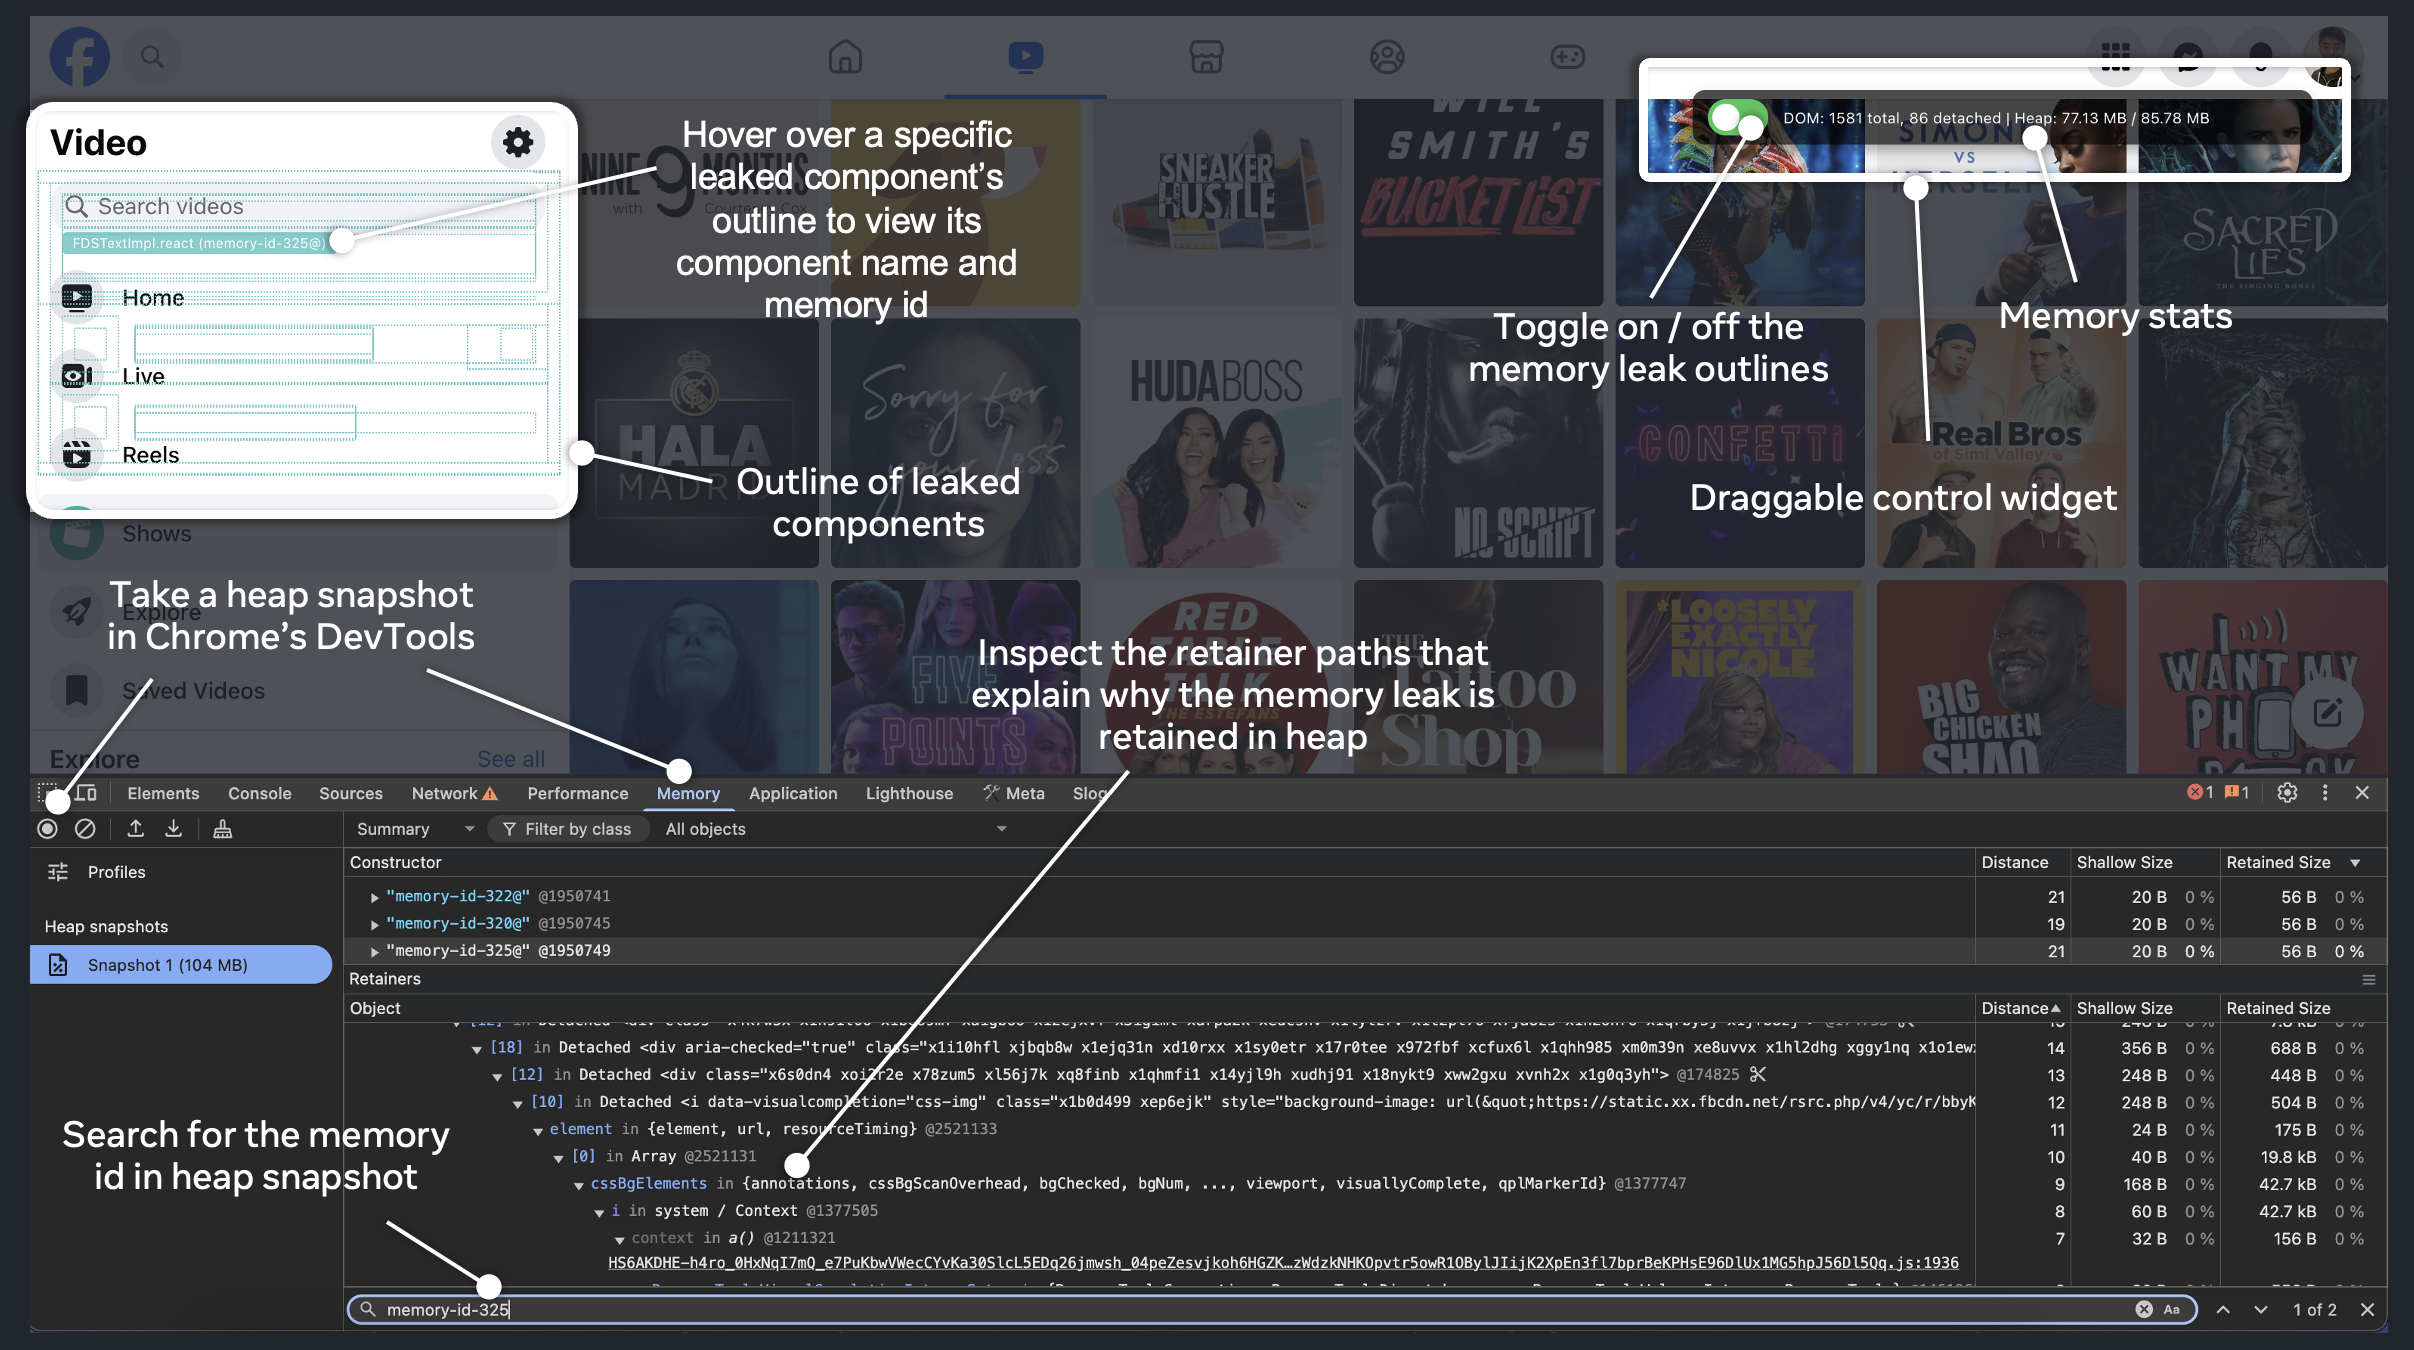
MemLens: Browser Memory Debugging Tools - Enables visualization of memory
leaks and interactive memory debugging in the browser.
Memory assertions in Node.js - Enables unit tests or running node.js
programs to take a heap snapshot of their own state, perform self memory
checking, or write advanced memory assertions
MCP server for AI coding assistants - Provides an MCP server that gives
AI coding assistants (Claude Code, Cursor, etc.) interactive tools to load
heap snapshots, find memory leaks, and investigate optimization opportunities
through natural language conversation
CLI Usage
Install the CLI
npm install -g memlab
Find Memory Leaks
To find memory leaks in Google Maps, you can create a
scenario file defining how
to interact with Google Maps. Let's call it test-google-maps.js:
// initial page load url: Google Maps
function url() {
  return 'https://www.google.com/maps/@37.386427,-122.0428214,11z';
}

// action where we want to detect memory leaks: click the Hotels button
async function action(page) {
  // puppeteer page API
  await page.click('text/Hotels');
}

// action where we want to go back to the step before: click clear search
async function back(page) {
  // puppeteer page API
  await page.click('[aria-label="Close"]');
}

module.exports = {action, back, url};
Now run memlab with the scenario file, memlab will interact with
the web page and detect memory leaks with built-in leak detectors:
memlab run --scenario test-google-maps.js
memlab will print memory leak results showing one representative
retainer trace for each cluster of leaked objects.
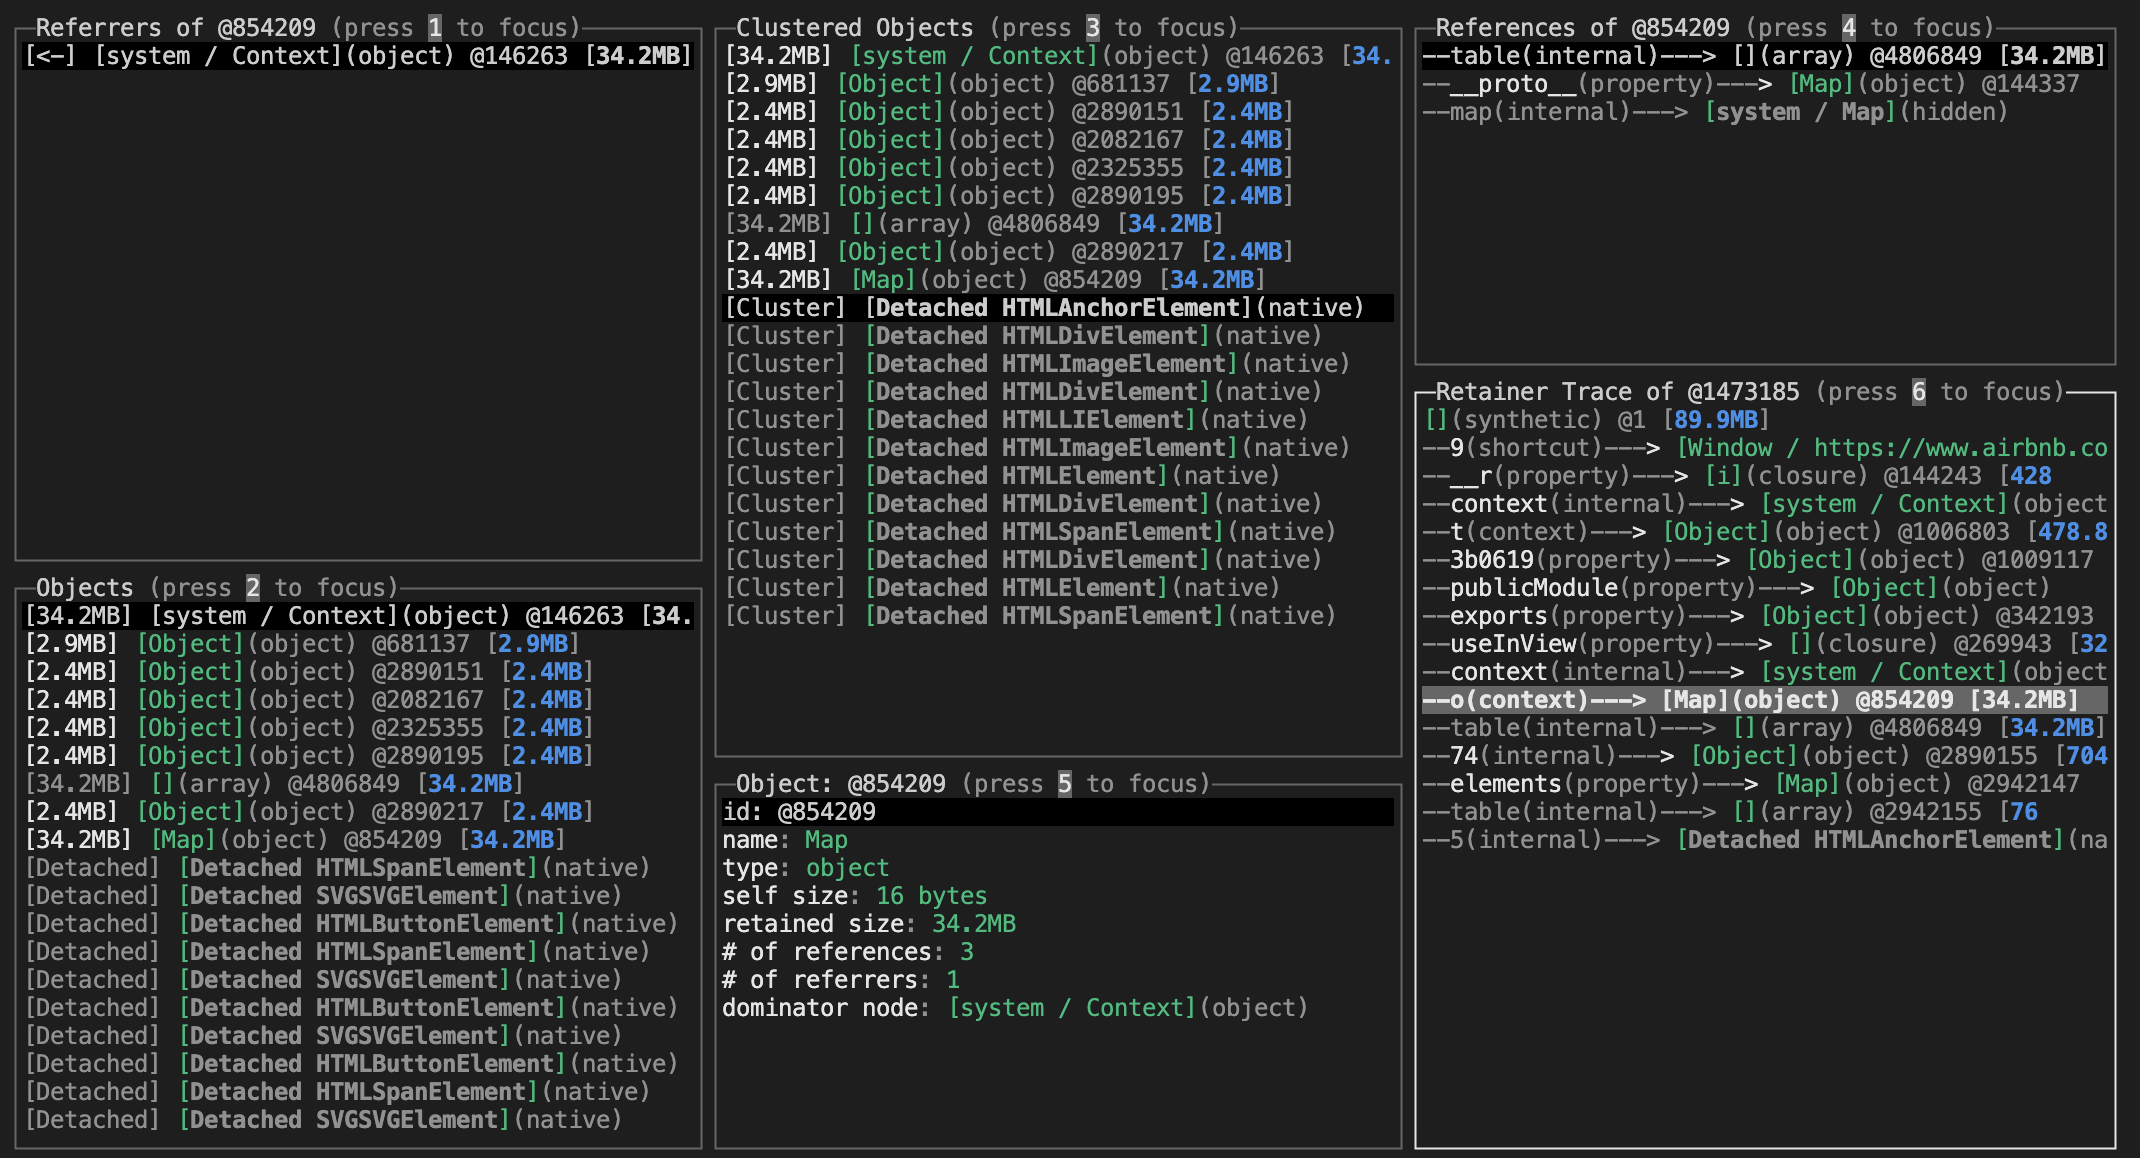
Retainer traces: This is the result from
an example website,
the retainer trace is an object reference chain from the GC root to a leaked
object. The trace shows why and how a leaked object is still kept alive in
memory. Breaking the reference chain means the leaked object will no longer
be reachable from the GC root, and therefore can be garbage collected.
By following the leak trace one step at a time, you will be able to find
a reference that should be set to null (but it wasn't due to a bug).
To get a readable trace, the website under test needs to serve non-minified code (or at least minified code
with readable variable, function, and property names on objects).
Alternatively, you can debug the leak by loading the heap snapshot taken by memlab (saved in $(memlab get-default-work-dir)/data/cur)
in Chrome DevTool and search for the leaked object ID (@182929).
View Retainer Trace Interactively
View memory issues detected by memlab based on a single JavaScript
heap snapshot taken from Chromium, Hermes, memlab, or any node.js
or Electron.js program:
memlab view-heap --snapshot <PATH TO .heapsnapshot FILE>
You can optionally specify a specific heap object with the object's id: --node-id @28173 to pinpoint a specific object.
Custom leak detector: If you want to use a custom leak detector, add a leakFilter callback
(doc)
in the scenario file. leakFilter will be called for every unreleased heap
object (node) allocated by the target interaction.
function leakFilter(node, heap) {
  // ... your leak detector logic
  // return true to mark the node as a memory leak
}
heap is the graph representation of the final JavaScript heap snapshot.
For more details, view the
doc site.
Heap Analysis and Investigation
View which object keeps growing in size during interaction in the previous run:
Use memlab analyze to view all built-in memory analyses.
For extension, view the doc site.
View retainer trace of a particular object:
memlab trace --node-id <HEAP_OBJECT_ID>
Use memlab help to view all CLI commands.
APIs
Use the memlab npm package to start an E2E run in the browser and detect memory leaks.
const memlab = require('memlab');

const scenario = {
  // initial page load url
  url: () => 'https://www.google.com/maps/@37.386427,-122.0428214,11z',

  // action where we want to detect memory leaks
  action: async page => await page.click('text/Hotels'),

  // action where we want to go back to the step before
  back: async page => await page.click('[aria-label="Close"]'),
};
memlab.run({scenario});
MCP Server for AI Coding Assistants
The @memlab/mcp-server package provides an
MCP (Model Context Protocol) server that
wraps MemLab's heap analysis APIs, giving AI coding assistants (Claude Code,
Cursor, Windsurf, etc.) interactive tools to explore JavaScript heap snapshots,
find memory leaks, and identify optimization opportunities — all through
natural language conversation.
Setup
Install globally and add to your MCP config (~/.claude.json for Claude Code,
or .mcp.json for Cursor/Windsurf):
Once connected, the MCP server exposes tools for heap snapshot analysis
including: loading snapshots, viewing summaries, finding the largest objects
by retained size, looking up retainer traces, detecting detached DOM nodes,
inspecting closures, searching nodes by class/property/pattern, analyzing
duplicated strings, and more. See the
@memlab/mcp-server README for the full
tool reference and example workflows, and the
MCP Investigation Skill for a structured
methodology on how AI assistants can systematically investigate memory leaks
using the MCP tools.
Visual Debugging for Memory Leaks in Browser
Please check out this tutorial page
on how to use MemLens (a debugging utility) to
visualize memory leaks in the browser for easier memory debugging.
Memory Assertions
memlab makes it possible for a unit test or running Node.js program
to take a heap snapshot of its own state and write advanced memory assertions:
// save as example.test.ts
import type {IHeapSnapshot, Nullable} from '@memlab/core';
import {config, takeNodeMinimalHeap} from '@memlab/core';

class TestObject {
  public arr1 = [1, 2, 3];
  public arr2 = ['1', '2', '3'];
}

test('memory test with heap assertion', async () => {
  config.muteConsole = true; // no console output

  let obj: Nullable<TestObject> = new TestObject();
  // get a heap snapshot of the current program state
  let heap: IHeapSnapshot = await takeNodeMinimalHeap();

  // call some function that may add references to obj
  rabbitHole(obj);

  expect(heap.hasObjectWithClassName('TestObject')).toBe(true);
  obj = null;

  heap = await takeNodeMinimalHeap();
  // if rabbitHole does not have any side effect that
  // adds new references to obj, then obj can be GCed
  expect(heap.hasObjectWithClassName('TestObject')).toBe(false);
}, 30000);
For other APIs check out the
API documentation.
AI Assistant Guide
The AI.md file provides structured guidance for AI coding
assistants (Claude Code, Cursor, GitHub Copilot, ChatGPT, etc.) working with
MemLab. It covers:
Creating test scenarios — how to write MemLab scenario files using the
IScenario interface, correct Puppeteer Page API usage, and common pitfalls
to avoid
Interpreting retainer traces — how to read the reference chain from GC
root to a leaked object and identify which reference to break
Using heap analysis plugins — the built-in analysis plugins available via
memlab analyze and how to use the programmatic API
MCP server tools — how AI assistants can use the @memlab/mcp-server to
interactively load, query, and analyze heap snapshots
Development
Use node version 16 or above. To build on Windows, please use Git Bash.
First build the project as follows:
npm install
npm run build
Then keep this helper script running to ensure that local changes are picked up
and compiled automatically during development:
npm run dev
NOTE: To run the memlab cli locally, make sure to prefix the memlab command with
npx from within the memlab repo e.g. npx memlab
Run tests:
npm run test
License
memlab is MIT licensed, as found in the LICENSE file.
Contributing
Check our contributing guide to learn how to
contribute to the project.
Code of Conduct
Check our Code of Conduct to learn more about our
contributor standards and expectations.
The most recent commit recorded on facebook/memlab was 22 days ago, based on the GitHub push timestamp. The repository has 143 forks — one of the better signals of community interest.
How many stars does facebook/memlab have?
facebook/memlab has 5.0k GitHub stars — refresh the page for the live number, or check github.com/facebook/memlab. TopGit mirrors GitHub's count but does not claim minute-by-minute accuracy.
Is facebook/memlab open source?
Yes — facebook/memlab ships under the MIT license, which makes its source code freely readable (and, depending on license terms, forkable and reusable). Source: github.com/facebook/memlab.
What else is in the Frontend space?
facebook/memlab is tracked by TopGit under the Frontend category, alongside 13 GitHub-tagged topics. Trending and Topics pages list peer repositories of comparable stars and language.
What is facebook/memlab?
facebook/memlab (facebook/memlab) is a TypeScript project on GitHub. From the project's own README: A framework for finding JavaScript memory leaks and analyzing heap snapshots
What language is facebook/memlab written in?
facebook/memlab is written primarily in TypeScript. GitHub's language field is based on the largest share of bytes in the default branch.
What license does facebook/memlab use?
facebook/memlab is released under the MIT license. Always verify the LICENSE file directly on GitHub for the authoritative terms — license strings can be edited out of sync with a project's actual stance.
Where do I read more about facebook/memlab?
This TopGit page is a snapshot — the READ ME tab shows the project's own README content (links stripped, images preserved). The GitHub repository at github.com/facebook/memlab is the definitive source.
Read full README in the tab above.
Still deciding about memlab?
One click hands the question to an AI along with this page — see what it says about memlab.
 /memlab