Snapshot of mickamy/sql-tap: 1.6k★, Go, Image Tools. Watch SQL traffic in real-time with a TUI
Snapshot summary built from the project's own GitHub metadata — there's no written TopGit review yet. The page will update automatically when a full review is published.
WHY NO REVIEW YET
TopGit writes full reviews for the most-starred, most-requested repositories. This page is a snapshot until then — see the READ ME tab for the original README in full.
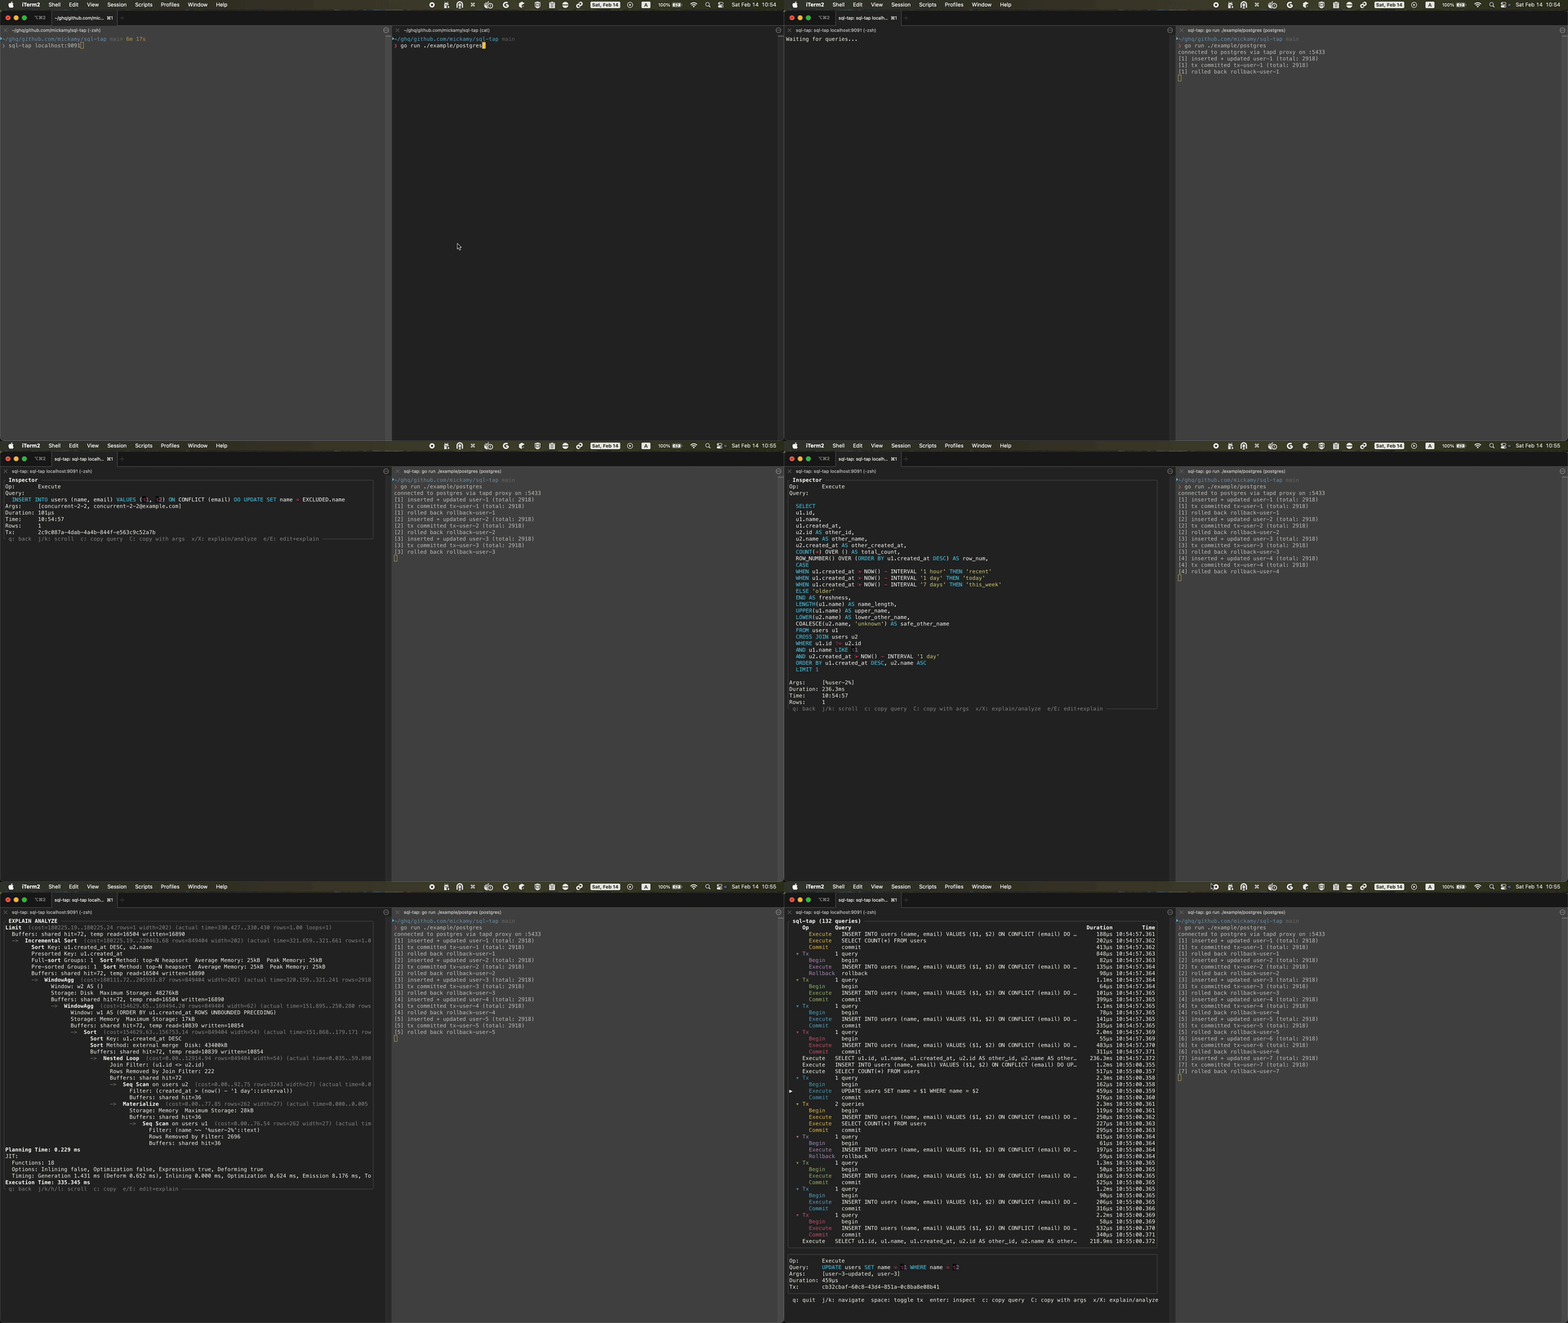
sql-tap sits between your application and your database (PostgreSQL, MySQL, or TiDB), capturing every query and
displaying it in an interactive terminal UI. Inspect queries, view transactions, and run EXPLAIN — all without changing
your application code.
Installation
Homebrew
brew install mickamy/tap/sql-tap
Go
go install github.com/mickamy/sql-tap@latest
go install github.com/mickamy/sql-tap/cmd/sql-tapd@latest
Build from source
git clone https://github.com/mickamy/sql-tap.git
cd sql-tap
make install
FROM alpine:3
ARG SQL_TAP_VERSION=0.0.1
ARG TARGETARCH
ADD https://github.com/mickamy/sql-tap/releases/download/v${SQL_TAP_VERSION}/sql-tap_${SQL_TAP_VERSION}_linux_${TARGETARCH}.tar.gz /tmp/sql-tap.tar.gz
RUN tar -xzf /tmp/sql-tap.tar.gz -C /usr/local/bin sql-tapd && rm /tmp/sql-tap.tar.gz
ENTRYPOINT ["sql-tapd"]
Run as a sidecar alongside your database:
# PostgreSQL
docker run --rm --network=host sql-tap \
  --driver=postgres --listen=:5433 --upstream=localhost:5432 --grpc=:9091

# MySQL
docker run --rm --network=host sql-tap \
  --driver=mysql --listen=:3307 --upstream=localhost:3306 --grpc=:9091
Quick start
1. Start the proxy daemon
# PostgreSQL: proxy listens on :5433, forwards to PostgreSQL on :5432
DATABASE_URL="postgres://user:pass@localhost:5432/db?sslmode=disable" \
  sql-tapd --driver=postgres --listen=:5433 --upstream=localhost:5432

# MySQL: proxy listens on :3307, forwards to MySQL on :3306
DATABASE_URL="user:pass@tcp(localhost:3306)/db" \
  sql-tapd --driver=mysql --listen=:3307 --upstream=localhost:3306

# TiDB: proxy listens on :4001, forwards to TiDB on :4000
DATABASE_URL="user:pass@tcp(localhost:4000)/db" \
  sql-tapd --driver=tidb --listen=:4001 --upstream=localhost:4000
2. Point your application at the proxy
Connect your app to the proxy port instead of the database port. No code changes needed — sql-tapd speaks the native
wire protocol.
3. Launch the TUI
sql-tap localhost:9091
All queries flowing through the proxy appear in real-time.
Usage
sql-tapd
sql-tapd — SQL proxy daemon for sql-tap

Usage:
  sql-tapd [flags]

Flags:
  -config    path to config file (default: .sql-tap.yaml if exists)
  -driver    database driver: postgres, mysql, tidb (required)
  -listen    client listen address (required)
  -upstream  upstream database address (required)
  -grpc      gRPC server address for TUI (default: ":9091")
  -http      HTTP server address for web UI (e.g. ":8080")
  -dsn-env   env var holding DSN for EXPLAIN (default: "DATABASE_URL")
  -nplus1-threshold  N+1 detection threshold (default: 5, 0 to disable)
  -nplus1-window     N+1 detection time window (default: 1s)
  -nplus1-cooldown   N+1 alert cooldown per query template (default: 10s)
  -slow-threshold    slow query threshold (default: 100ms, 0 to disable)
  -version   show version and exit
Set DATABASE_URL (or the env var specified by -dsn-env) to enable EXPLAIN support. Without it, the proxy still
captures queries but EXPLAIN is disabled.
Config file
Instead of passing flags on every invocation, you can create a .sql-tap.yaml in your project directory:
sql-tap — Watch SQL traffic in real-time

Usage:
  sql-tap [flags] <addr>

Flags:
  -ci       run in CI mode: collect events until SIGTERM/SIGINT or stream ends, then report and exit
  -version  Show version and exit
<addr> is the gRPC address of sql-tapd (e.g. localhost:9091).
CI mode
Run sql-tap -ci to detect N+1 and slow queries in your test suite. It connects to a running sql-tapd (see Quick start for setup), collects events, and exits with code 1 if any problems are found.
# Start sql-tap in CI mode (background)
sql-tap -ci localhost:9091 &
CI_PID=$!

# Run your tests through the proxy
DATABASE_URL="postgres://user:pass@localhost:5433/db?sslmode=disable" go test ./...

# Stop sql-tap — prints report and exits 0 (clean) or 1 (problems found)
kill "$CI_PID" 2>/dev/null || true
wait "$CI_PID" 2>/dev/null || true
Example output:
sql-tap CI Report
=================
Captured: 142 queries

Problems found:
  [N+1]  SELECT * FROM comments WHERE post_id = $1  (detected 12 times)
  [SLOW] SELECT * FROM users JOIN ...  (avg 523ms, 3 occurrences)

Exit: 1 (2 problems found)
Keybindings
List view
Key
Action
j / ↓
Move down
k / ↑
Move up
Ctrl+d / PgDn
Half-page down
Ctrl+u / PgUp
Half-page up
/
Incremental text search
f
Structured filter (see below)
s
Toggle sort (chronological/duration)
Enter
Inspect query / transaction
Space
Toggle transaction expand / collapse
Esc
Clear search / filter
x
EXPLAIN
X
EXPLAIN ANALYZE
e
Edit query, then EXPLAIN
E
Edit query, then EXPLAIN ANALYZE
a
Analytics view
t
Timeline view
c
Copy query
C
Copy query with bound args
w
Export queries to file (JSON/Markdown)
q
Quit
Inspector view
Key
Action
j / ↓
Scroll down
k / ↑
Scroll up
x
EXPLAIN
X
EXPLAIN ANALYZE
e / E
Edit and EXPLAIN / ANALYZE
c
Copy query
C
Copy query with bound args
q
Back to list
Analytics view
Key
Action
j / ↓
Move down
k / ↑
Move up
Ctrl+d
Half-page down
Ctrl+u
Half-page up
h / ←
Scroll left
l / →
Scroll right
s
Cycle sort (total/count/avg)
c
Copy query
q
Back to list
Timeline view
Key
Action
j / ↓
Scroll down
k / ↑
Scroll up
Ctrl+d / PgDn
Half-page down
Ctrl+u / PgUp
Half-page up
q
Back to list
Explain view
Key
Action
j / ↓
Scroll down
k / ↑
Scroll up
h / ←
Scroll left
l / →
Scroll right
c
Copy explain plan
e / E
Edit and re-explain / re-analyze
q
Back to list
Filter syntax
Press f in the list view to enter filter mode. Filters support structured conditions that go beyond simple text
search.
Syntax
Meaning
Example
d>100ms
Duration greater than
d>1s, d>500us
d<10ms
Duration less than
d<50ms
error
Events with errors only
n+1
N+1 flagged queries
alias: nplus1
slow
Slow queries only
op:select
SQL keyword prefix
op:insert, op:update, op:delete
op:begin
Protocol operation
op:commit, op:rollback
(other)
Text substring match
users, WHERE id
Multiple tokens are separated by spaces and combined with AND logic:
op:select d>100ms
This shows only SELECT queries that took longer than 100ms.
Both / (text search) and f (filter) can be active simultaneously — the filter is applied first, then the text search
narrows the results further.
N+1 query detection
sql-tap automatically detects N+1 query patterns — when the same SELECT template is executed many times in a short time
window.
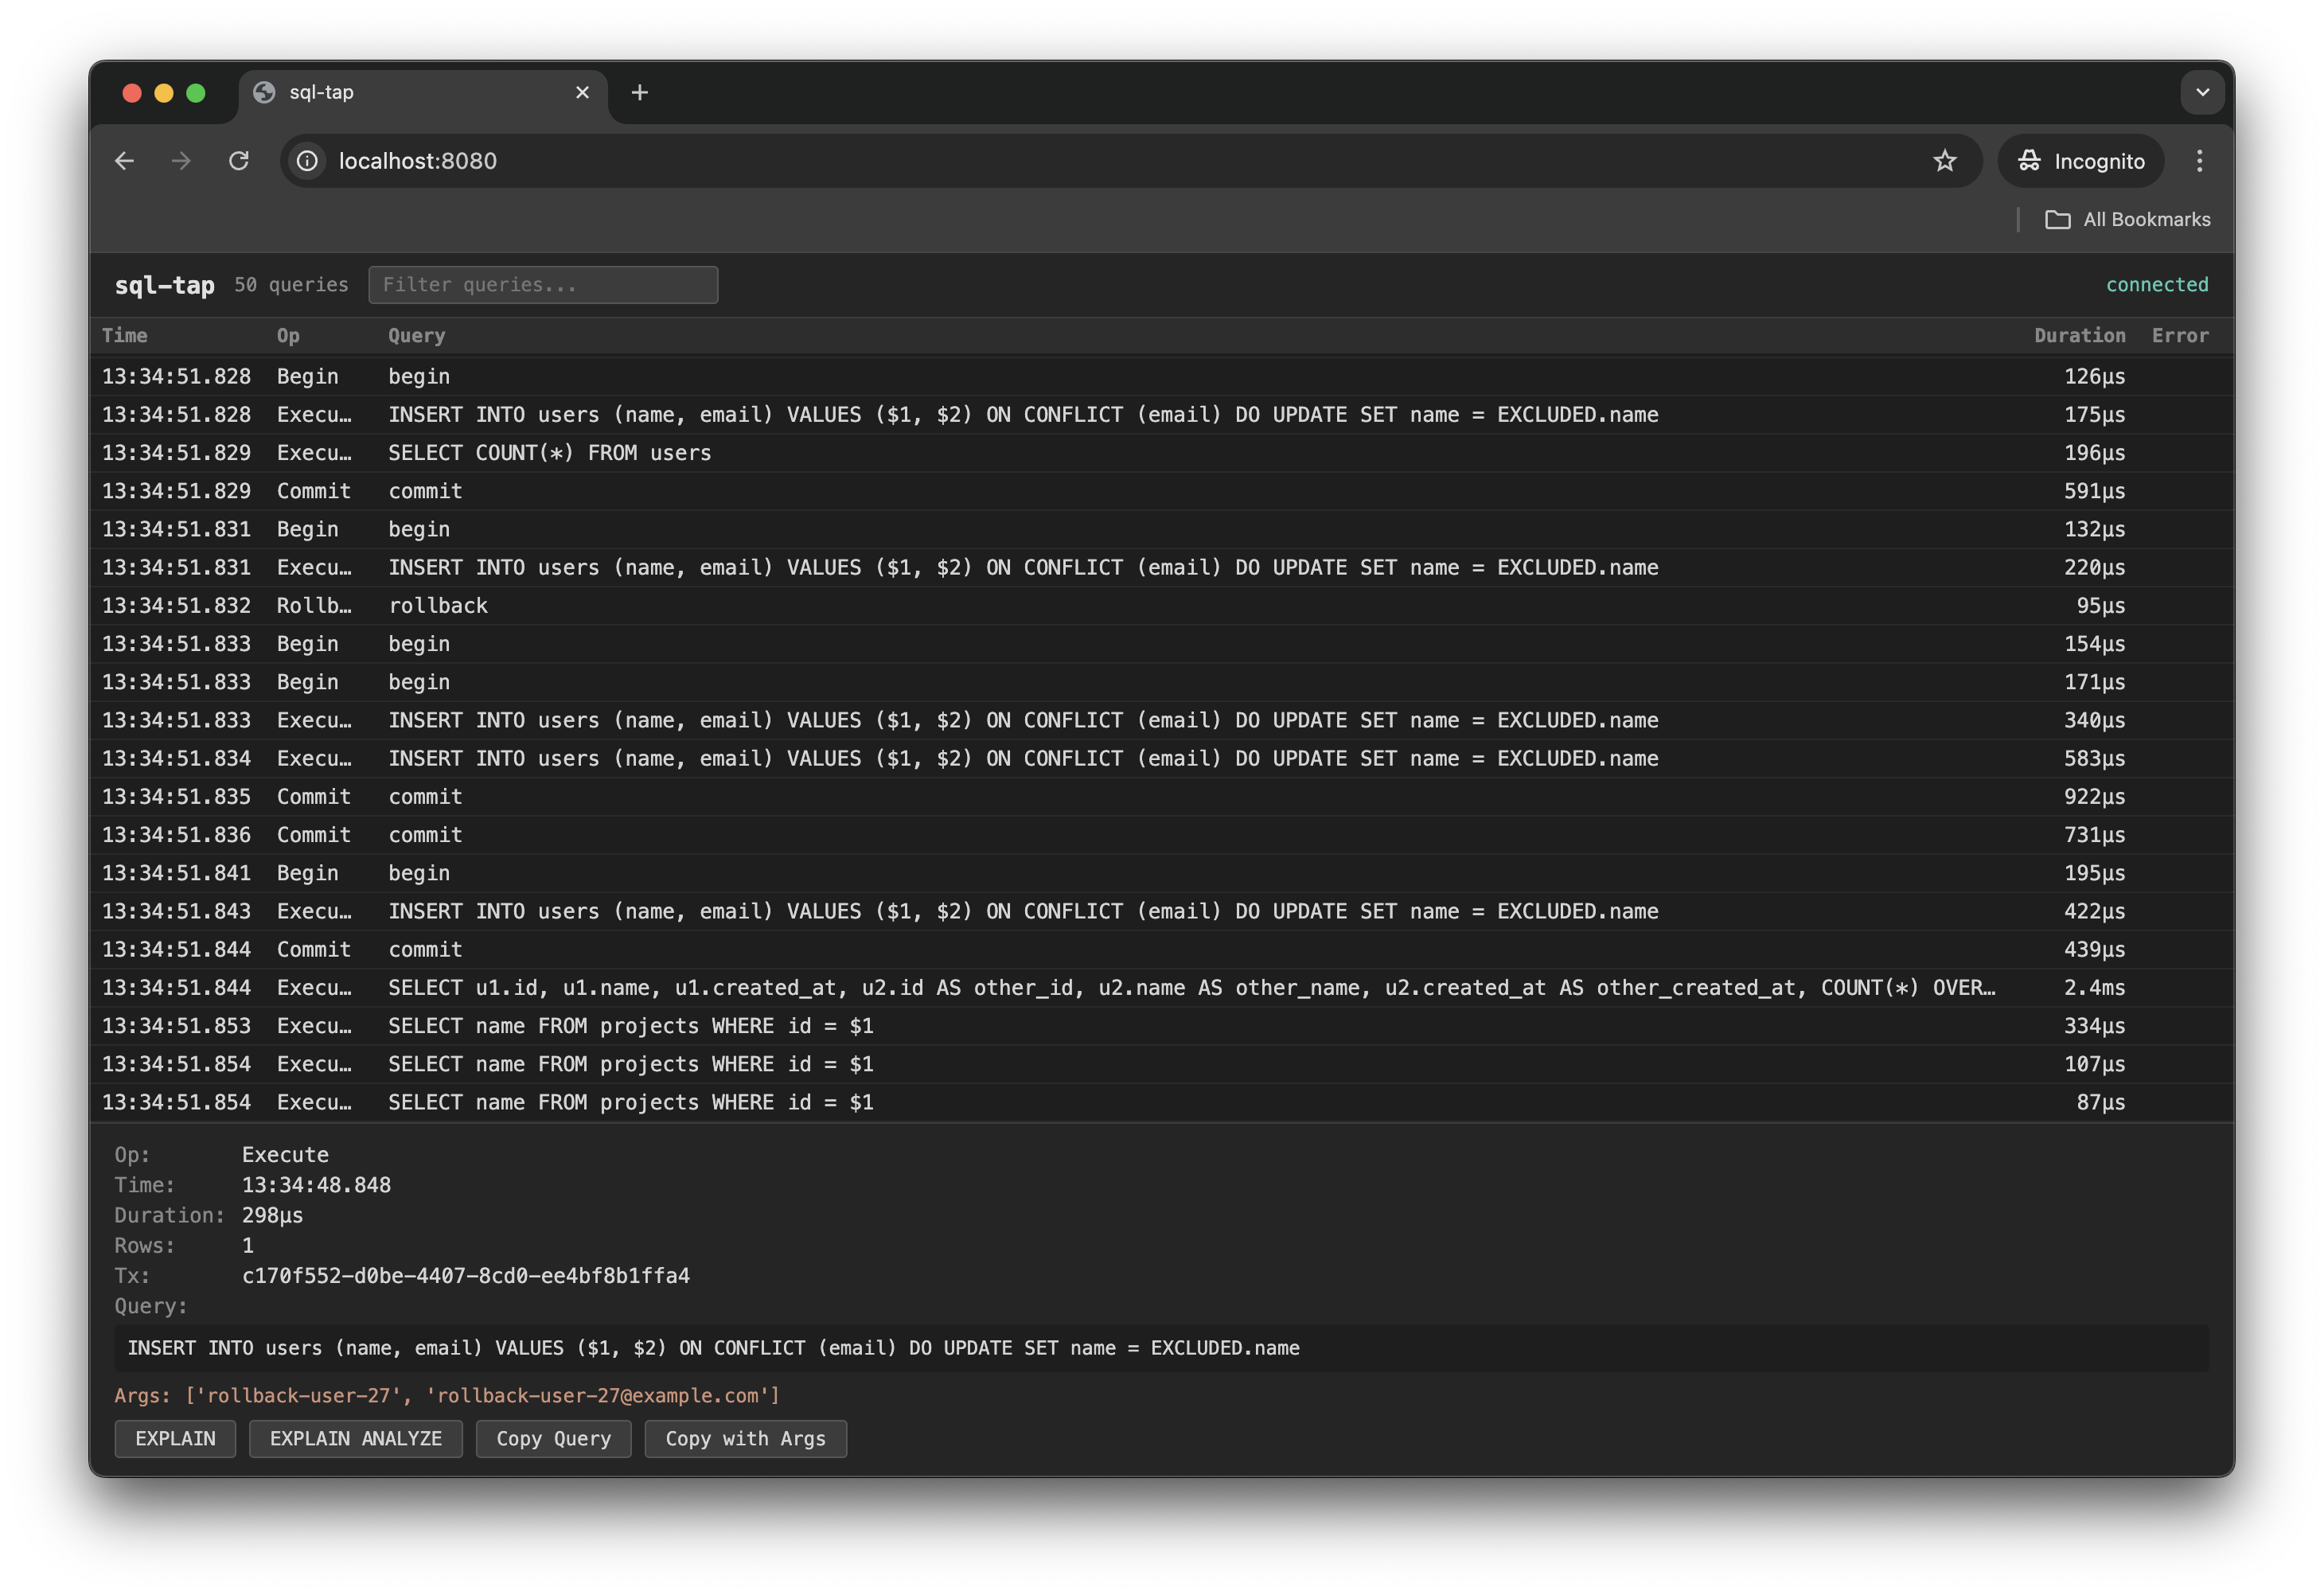
Detection is enabled by default and runs server-side, so both TUI and Web UI benefit:
TUI: alert overlay on first detection + N+1 marker in the Status column for every flagged query
Web UI: toast notification on first detection + yellow row highlight + N+1 in the Status column
Configuration
Flag
Default
Description
--nplus1-threshold
5
Number of executions to trigger detection (0 to disable)
--nplus1-window
1s
Sliding time window for counting
--nplus1-cooldown
10s
Minimum interval between alert notifications for the same query
Only SELECT queries are monitored. INSERT, UPDATE, DELETE, and transaction lifecycle commands (BEGIN, COMMIT, etc.) are
excluded. Metadata queries — SELECT statements without a FROM clause, such as SELECT database(), SELECT @@version,
or SELECT 1 — are also excluded, as they are typically driver health checks or system introspection calls rather than
application data queries.
Once the threshold is crossed, all subsequent executions of the same template within the window are flagged. The
cooldown only affects the notification frequency — the Status column marker always appears.
To disable detection entirely:
sql-tapd --nplus1-threshold=0 ...
Known limitations
Arrow key input in search / filter mode
Due to a limitation in the terminal input parser used by Bubble Tea v1,
multi-byte escape sequences (such as arrow keys: ESC [ A/B/C/D) can occasionally be split across OS-level read()
calls. When this happens, the remaining bytes ([A, [B, [C, [D, [F, [H) would appear as garbage text in the
input field.
sql-tap includes a workaround that detects and discards these split sequences. As a side effect, the literal
two-character strings [A, [B, [C, [D, [F, and [H cannot be typed in search or filter input. This is unlikely
to affect real-world usage since these patterns rarely appear in SQL queries.
sql-tapd parses the database wire protocol (PostgreSQL, MySQL, or TiDB) to intercept queries transparently. It tracks prepared statements, parameter bindings, transactions, execution time, rows affected, and errors. Events are streamed to connected TUI clients via gRPC.
See also
grpc-tap — Same concept for gRPC. Transparent HTTP/2 reverse proxy that
captures every gRPC / gRPC-Web / Connect call with TUI + Web UI.
The most recent commit recorded on mickamy/sql-tap was 1 month ago, based on the GitHub push timestamp. The repository has 49 forks — one of the better signals of community interest.
How does mickamy/sql-tap compare to other Image Tools projects?
mickamy/sql-tap is tracked by TopGit in the Image Tools category, with 1.6k GitHub stars and written in Go. Browse the Image Tools topic page on TopGit to compare it against similar projects by stars and activity.
How many stars does mickamy/sql-tap have?
mickamy/sql-tap has 1.6k GitHub stars — refresh the page for the live number, or check github.com/mickamy/sql-tap. TopGit mirrors GitHub's count but does not claim minute-by-minute accuracy.
Is mickamy/sql-tap open source?
Yes — mickamy/sql-tap ships under the MIT license, which makes its source code freely readable (and, depending on license terms, forkable and reusable). Source: github.com/mickamy/sql-tap.
What is mickamy/sql-tap?
mickamy/sql-tap (mickamy/sql-tap) is a Go project on GitHub. From the project's own README: Watch SQL traffic in real-time with a TUI
Where do I read more about mickamy/sql-tap?
This TopGit page is a snapshot — the READ ME tab shows the project's own README content (links stripped, images preserved). The GitHub repository at github.com/mickamy/sql-tap is the definitive source.
Read full README in the tab above.
Curious whether sql-tap is right for you?
Let ChatGPT, Claude, or Perplexity look into it — click below and see what AI actually says about sql-tap.
 /sql-tap