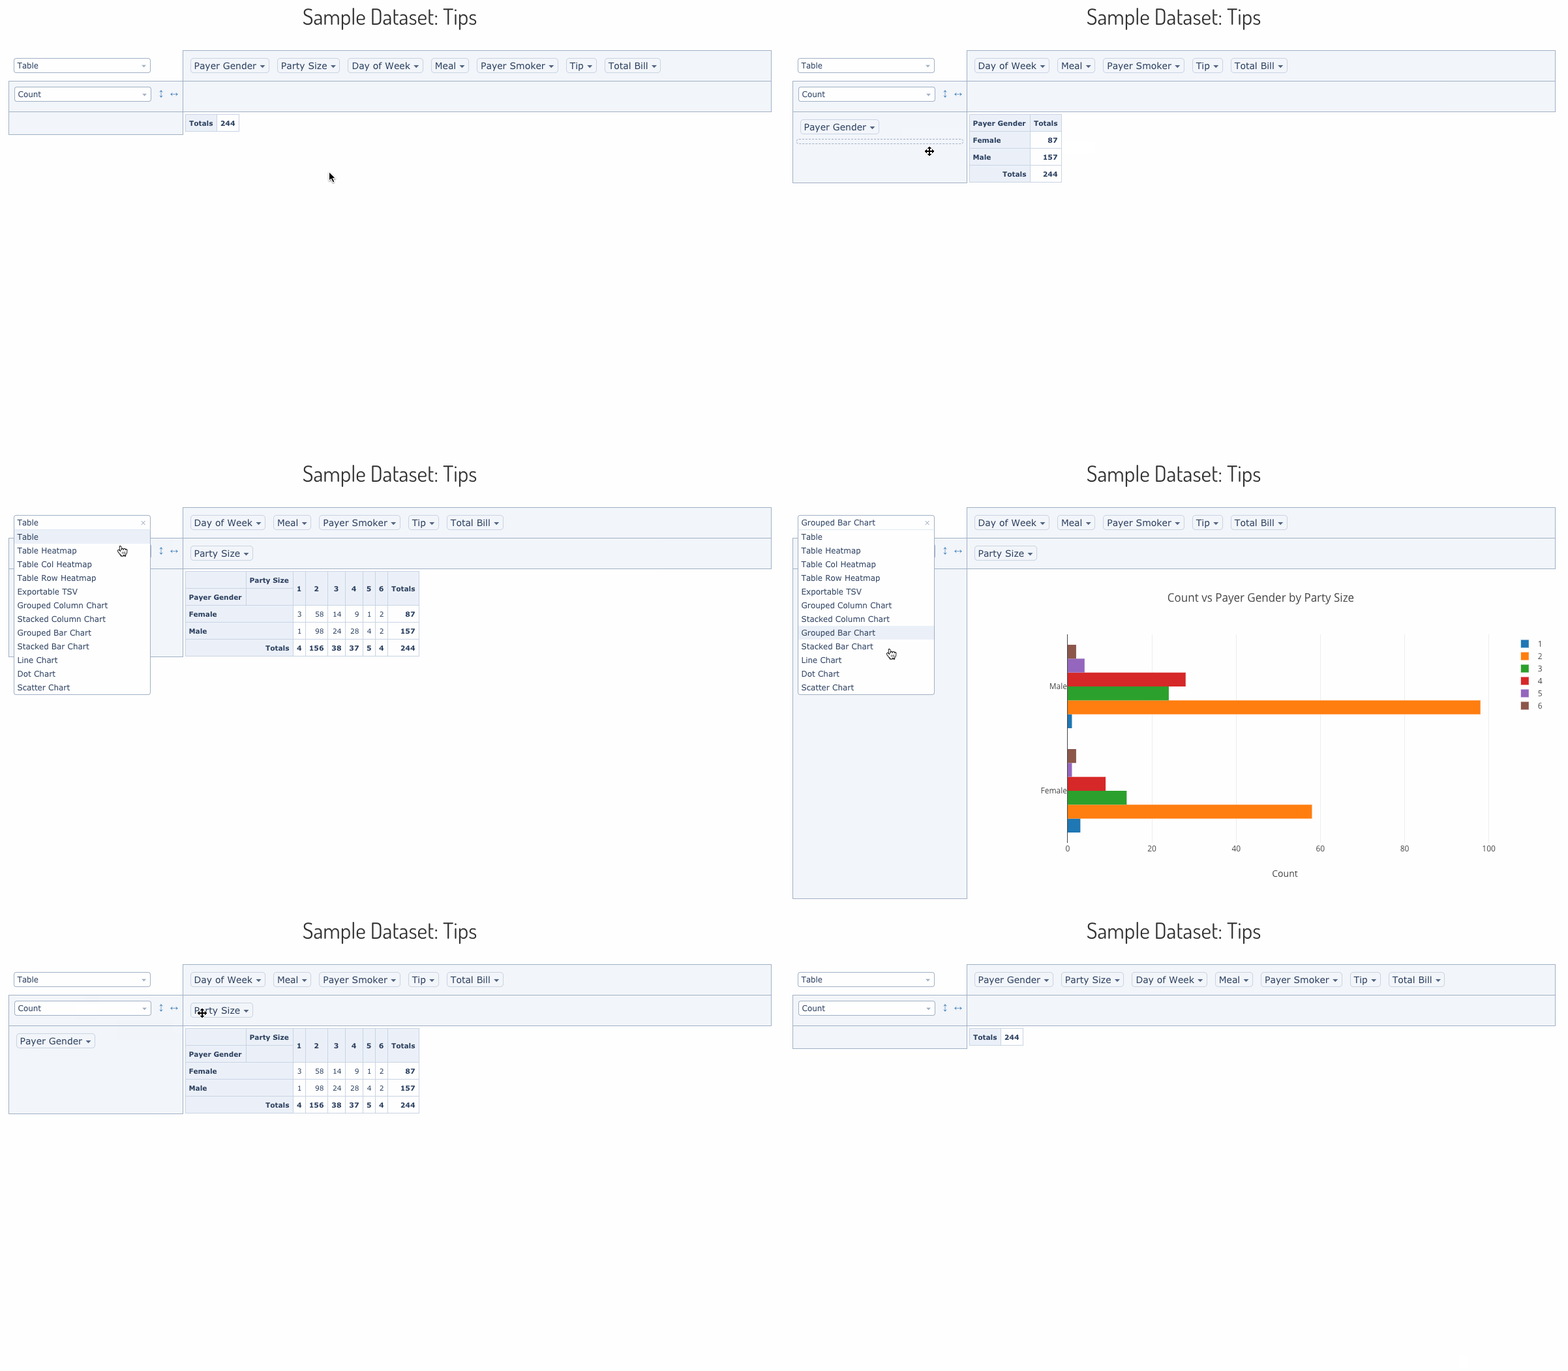
plotly/react-pivottable is one of the UI-focused repositories TopGit tracks, currently at 1.1k stars, written primarily in JavaScript. React-based drag'n'drop pivot table with Plotly.js charts
Snapshot summary built from the project's own GitHub metadata — there's no written TopGit review yet. The page will update automatically when a full review is published.
WHY NO REVIEW YET
TopGit writes full reviews for the most-starred, most-requested repositories. This page is a snapshot until then — see the READ ME tab for the original README in full.
react-pivottable is a React-based pivot table library with drag'n'drop
functionality. It is a React port of the jQuery-based
PivotTable.js by the same author.
react-pivottable is part of Plotly's React Component Suite for building data visualization Web apps and products.
What does it do & where is the demo?
react-pivottable's function is to enable data exploration and analysis by
summarizing a data set into table or Plotly.js
chart with a true 2-d drag'n'drop UI, very similar to the one found in older
versions of Microsoft Excel.
A live demo can be found here.
How can I use it in my project?
Drag'n'drop UI with Table output only
Installation is via NPM and has a peer dependency on React:
Basic usage is as follows. Note that PivotTableUI is a "dumb component" that
maintains essentially no state of its own.
import React from 'react';
import ReactDOM from 'react-dom';
import PivotTableUI from 'react-pivottable/PivotTableUI';
import 'react-pivottable/pivottable.css';

// see documentation for supported input formats
const data = [['attribute', 'attribute2'], ['value1', 'value2']];

class App extends React.Component {
    constructor(props) {
        super(props);
        this.state = props;
    }

    render() {
        return (
            <PivotTableUI
                data={data}
                onChange={s => this.setState(s)}
                {...this.state}
            />
        );
    }
}

ReactDOM.render(<App />, document.body);
Drag'n'drop UI with Plotly charts as well as Table output
The Plotly react-plotly.js component can be passed in via dependency
injection. It has a peer dependency on plotly.js.
Important: If you build your project using webpack, you'll have to follow
these instructions
in order to successfully bundle plotly.js. See below for how to avoid having
to bundle plotly.js.
To add the Plotly renderers to your app, you can use the following pattern:
import React from 'react';
import PivotTableUI from 'react-pivottable/PivotTableUI';
import 'react-pivottable/pivottable.css';
import TableRenderers from 'react-pivottable/TableRenderers';
import Plot from 'react-plotly.js';
import createPlotlyRenderers from 'react-pivottable/PlotlyRenderers';

// create Plotly renderers via dependency injection
const PlotlyRenderers = createPlotlyRenderers(Plot);

// see documentation for supported input formats
const data = [['attribute', 'attribute2'], ['value1', 'value2']];

class App extends React.Component {
    constructor(props) {
        super(props);
        this.state = props;
    }

    render() {
        return (
            <PivotTableUI
                data={data}
                onChange={s => this.setState(s)}
                renderers={Object.assign({}, TableRenderers, PlotlyRenderers)}
                {...this.state}
            />
        );
    }
}

ReactDOM.render(<App />, document.body);
With external plotly.js
If you would rather not install and bundle plotly.js but rather get it into
your app via something like <script> tag, you can ignore react-plotly.js'
peer-dependcy warning and handle the dependency injection like this:
import React from 'react';
import PivotTableUI from 'react-pivottable/PivotTableUI';
import 'react-pivottable/pivottable.css';
import TableRenderers from 'react-pivottable/TableRenderers';
import createPlotlyComponent from 'react-plotly.js/factory';
import createPlotlyRenderers from 'react-pivottable/PlotlyRenderers';

// create Plotly React component via dependency injection
const Plot = createPlotlyComponent(window.Plotly);

// create Plotly renderers via dependency injection
const PlotlyRenderers = createPlotlyRenderers(Plot);

// see documentation for supported input formats
const data = [['attribute', 'attribute2'], ['value1', 'value2']];

class App extends React.Component {
    constructor(props) {
        super(props);
        this.state = props;
    }

    render() {
        return (
            <PivotTableUI
                data={data}
                onChange={s => this.setState(s)}
                renderers={Object.assign({}, TableRenderers, PlotlyRenderers)}
                {...this.state}
            />
        );
    }
}

ReactDOM.render(<App />, document.body);
Properties and layered architecture
<PivotTableUI {...props} />
<PivotTable {...props} />
<Renderer {...props} />
PivotData(props)
The interactive component provided by react-pivottable is PivotTableUI, but
output rendering is delegated to the non-interactive PivotTable component,
which accepts a subset of its properties. PivotTable can be invoked directly
and is useful for outputting non-interactive saved snapshots of PivotTableUI
configurations. PivotTable in turn delegates to a specific renderer component,
such as the default TableRenderer, which accepts a subset of the same
properties. Finally, most renderers will create non-React PivotData object to
handle the actual computations, which also accepts a subset of the same props as
the rest of the stack.
Here is a table of the properties accepted by this stack, including an
indication of which layer consumes each, from the bottom up:
Layer
Key & Type
Default Value
Description
PivotData
data see below for formats
(none, required)
data to be summarized
PivotData
rows array of strings
[]
attribute names to prepopulate in row area
PivotData
cols array of strings
[]
attribute names to prepopulate in cols area
PivotData
vals array of strings
[]
attribute names used as arguments to aggregator (gets passed to aggregator generating function)
PivotData
aggregators object of functions
aggregators from Utilites
dictionary of generators for aggregation functions in dropdown (see original PivotTable.js documentation)
PivotData
aggregatorName string
first key in aggregators
key to aggregators object specifying the aggregator to use for computations
PivotData
valueFilter object of arrays of strings
{}
object whose keys are attribute names and values are objects of attribute value-boolean pairs which denote records to include or exclude from computation and rendering; used to prepopulate the filter menus that appear on double-click
PivotData
sorters object or function
{}
accessed or called with an attribute name and can return a function which can be used as an argument to array.sort for output purposes. If no function is returned, the default sorting mechanism is a built-in "natural sort" implementation. Useful for sorting attributes like month names, see original PivotTable.js example 1 and original PivotTable.js example 2.
PivotData
rowOrder string
"key_a_to_z"
the order in which row data is provided to the renderer, must be one of "key_a_to_z", "value_a_to_z", "value_z_to_a", ordering by value orders by row total
PivotData
colOrder string
"key_a_to_z"
the order in which column data is provided to the renderer, must be one of "key_a_to_z", "value_a_to_z", "value_z_to_a", ordering by value orders by column total
PivotData
derivedAttributes object of functions
{}
defines derived attributes (see original PivotTable.js documentation)
Renderer
<any>
(none, optional)
Renderers may accept any additional properties
PivotTable
renderers object of functions
TableRenderers
dictionary of renderer components
PivotTable
rendererName string
first key in renderers
key to renderers object specifying the renderer to use
PivotTableUI
onChange function
(none, required)
function called every time anything changes in the UI, with the new value of the properties needed to render the new state. This function must be hooked into a state-management system in order for the "dumb" PivotTableUI component to work.
PivotTableUI
hiddenAttributes array of strings
[]
contains attribute names to omit from the UI
PivotTableUI
hiddenFromAggregators array of strings
[]
contains attribute names to omit from the aggregator arguments dropdowns
PivotTableUI
hiddenFromDragDrop array of strings
[]
contains attribute names to omit from the drag'n'drop portion of the UI
PivotTableUI
menuLimit integer
500
maximum number of values to list in the double-click menu
PivotTableUI
unusedOrientationCutoff integer
85
If the attributes' names' combined length in characters exceeds this value then the unused attributes area will be shown vertically to the left of the UI instead of horizontally above it. 0 therefore means 'always vertical', and Infinity means 'always horizontal'.
Accepted formats for data
Arrays of objects
One object per record, the object's keys are the attribute names.
Note: missing attributes or attributes with a value of null are treated as
if the value was the string "null".
One sub-array per record, the first sub-array contains the attribute names. If
subsequent sub-arrays are shorter than the first one, the trailing values are
treated as if they contained the string value "null". If subsequent sub-arrays
are longer than the first one, excess values are ignored. This format is
compatible with the output of CSV parsing libraries like PapaParse.
How active is development on plotly/react-pivottable?
The most recent commit recorded on plotly/react-pivottable was 7 months ago, based on the GitHub push timestamp. The repository has 290 forks — one of the better signals of community interest.
How many stars does plotly/react-pivottable have?
plotly/react-pivottable has 1.1k GitHub stars — refresh the page for the live number, or check github.com/plotly/react-pivottable. TopGit mirrors GitHub's count but does not claim minute-by-minute accuracy.
Is plotly/react-pivottable open source?
Yes — plotly/react-pivottable ships under the MIT license, which makes its source code freely readable (and, depending on license terms, forkable and reusable). Source: github.com/plotly/react-pivottable.
What else is in the Frontend space?
plotly/react-pivottable is tracked by TopGit under the Frontend category, alongside 2 GitHub-tagged topics. Trending and Topics pages list peer repositories of comparable stars and language.
What topics is plotly/react-pivottable associated with?
GitHub's repository topics for plotly/react-pivottable: "pivot-tables", "react". TopGit's editorial category is Frontend.
Where can I see plotly/react-pivottable in action?
The project maintains a homepage at https://react-pivottable.js.org/. The README tab on this page also usually contains screenshots and a quickstart.
Where do I read more about plotly/react-pivottable?
This TopGit page is a snapshot — the READ ME tab shows the project's own README content (links stripped, images preserved). The GitHub repository at github.com/plotly/react-pivottable is the definitive source.
Read full README in the tab above.
Curious whether react-pivottable is right for you?
Let ChatGPT, Claude, or Perplexity look into it — click below and see what AI actually says about react-pivottable.

 /react-pivottable