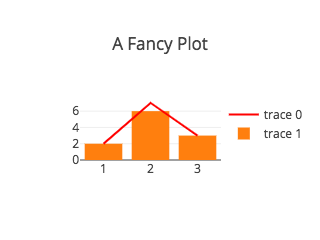
Snapshot of plotly/react-plotly.js: 1.1k★, JavaScript, Data. A plotly.js React component from Plotly 📈
Snapshot summary built from the project's own GitHub metadata — there's no written TopGit review yet. The page will update automatically when a full review is published.
WHY NO REVIEW YET
TopGit writes full reviews for the most-starred, most-requested repositories. This page is a snapshot until then — see the READ ME tab for the original README in full.
For a full description of Plotly chart types and attributes see the following resources:
Plotly JavaScript API documentation
Full plotly.js attribute listing
State management
This is a "dumb" component that doesn't merge its internal state with any updates. This means that if a user interacts with the plot, by zooming or panning for example, any subsequent re-renders will lose this information unless it is captured and upstreamed via the onUpdate callback prop.
Here is a simple example of how to capture and store state in a parent object:
This component will refresh the plot via Plotly.react if any of the following are true:
The revision prop is defined and has changed, OR;
One of data, layout or config has changed identity as checked via a shallow ===, OR;
The number of elements in frames has changed
Furthermore, when called, Plotly.react will only refresh the data being plotted if the identity of the data arrays (e.g. x, y, marker.color etc) has changed, or if layout.datarevision has changed.
In short, this means that simply adding data points to a trace in data or changing a value in layout will not cause a plot to update unless this is done immutably via something like immutability-helper if performance considerations permit it, or unless revision and/or layout.datarevision are used to force a rerender.
API Reference
Basic Props
Warning: for the time being, this component may mutate its layout and data props in response to user input, going against React rules. This behaviour will change in the near future once https://github.com/plotly/plotly.js/issues/2389 is completed.
Prop
Type
Default
Description
data
Array
[]
list of trace objects (see https://plotly.com/javascript/reference/)
layout
Object
undefined
layout object (see https://plotly.com/javascript/reference/#layout)
frames
Array
undefined
list of frame objects (see https://plotly.com/javascript/reference/)
config
Object
undefined
config object (see https://plotly.com/javascript/configuration-options/)
revision
Number
undefined
When provided, causes the plot to update when the revision is incremented.
onInitialized
Function(figure, graphDiv)
undefined
Callback executed after plot is initialized. See below for parameter information.
onUpdate
Function(figure, graphDiv)
undefined
Callback executed when a plot is updated due to new data or layout, or when user interacts with a plot. See below for parameter information.
onPurge
Function(figure, graphDiv)
undefined
Callback executed when component unmounts, before Plotly.purge strips the graphDiv of all private attributes. See below for parameter information.
onError
Function(err)
undefined
Callback executed when a plotly.js API method rejects
divId
string
undefined
id assigned to the <div> into which the plot is rendered.
className
string
undefined
applied to the <div> into which the plot is rendered
style
Object
{position: 'relative', display: 'inline-block'}
used to style the <div> into which the plot is rendered
debug
Boolean
false
Assign the graph div to window.gd for debugging
useResizeHandler
Boolean
false
When true, adds a call to Plotly.Plot.resize() as a window.resize event handler
Refs: a ref attached to <Plot> resolves to the rendered <div> element (the plotly graph div), so you can call low-level plotly.js APIs against it directly (e.g. Plotly.toImage(ref.current)).
TypeScript: this package ships its own declaration files. Trace and layout shapes are typed as unknown since the wrapper does not bind to a specific plotly.js type surface; consumers wanting tighter typing on the data / layout props can re-declare them locally.
Note: To make a plot responsive, i.e. to fill its containing element and resize when the window is resized, use style or className to set the dimensions of the element (i.e. using width: 100%; height: 100% or some similar values) and set useResizeHandler to true while setting layout.autosize to true and leaving layout.height and layout.width undefined. A short example is in the Responsive plot section below. See also the responsive layout reference.
Callback signature: Function(figure, graphDiv)
The onInitialized, onUpdate and onPurge props are all functions which will be called with two arguments: figure and graphDiv.
figure is a serializable object with three keys corresponding to input props: data, layout and frames.
As mentioned above, for the time being, this component may mutate its layout and data props in response to user input, going against React rules. This behaviour will change in the near future once https://github.com/plotly/plotly.js/issues/2389 is completed.
graphDiv is a reference to the (unserializable) DOM node into which the figure was rendered.
Event handler props
Event handlers for specific plotly.js events may be attached through the following props:
Prop
Type
Plotly Event
onAfterExport
Function
plotly_afterexport
onAfterPlot
Function
plotly_afterplot
onAnimated
Function
plotly_animated
onAnimating
Function
plotly_animating
onAnimatingFrame
Function
plotly_animatingframe
onAnimationInterrupted
Function
plotly_animationinterrupted
onAutoSize
Function
plotly_autosize
onBeforeExport
Function
plotly_beforeexport
onBeforeHover
Function
plotly_beforehover
onBeforePlot
Function
plotly_beforeplot
onButtonClicked
Function
plotly_buttonclicked
onClick
Function
plotly_click
onClickAnnotation
Function
plotly_clickannotation
onDeselect
Function
plotly_deselect
onDoubleClick
Function
plotly_doubleclick
onFramework
Function
plotly_framework
onHover
Function
plotly_hover
onIcicleClick
Function
plotly_icicleclick
onLegendClick
Function
plotly_legendclick
onLegendDoubleClick
Function
plotly_legenddoubleclick
onLegendTitleClick
Function
plotly_legendtitleclick
onLegendTitleDoubleClick
Function
plotly_legendtitledoubleclick
onRelayout
Function
plotly_relayout
onRelayouting
Function
plotly_relayouting
onRestyle
Function
plotly_restyle
onRedraw
Function
plotly_redraw
onSelected
Function
plotly_selected
onSelecting
Function
plotly_selecting
onSliderChange
Function
plotly_sliderchange
onSliderEnd
Function
plotly_sliderend
onSliderStart
Function
plotly_sliderstart
onSunburstClick
Function
plotly_sunburstclick
onTransitioned
Function
plotly_transitioned
onTransitioning
Function
plotly_transitioning
onTransitionInterrupted
Function
plotly_transitioninterrupted
onTreemapClick
Function
plotly_treemapclick
onUnhover
Function
plotly_unhover
onWebGlContextLost
Function
plotly_webglcontextlost
To receive onClick or onHover for positions that are not over a trace, set
clickanywhere or hoveranywhere in your layout. These are layout attributes
rather than distinct events: the ordinary plotly_click / plotly_hover fire
with an empty points array, plus xvals / yvals — arrays of the cursor
position in data space, one entry per axis.
To make the plot fill its container and resize with the window, leave the layout's width/height unset, enable autosize, and turn on useResizeHandler. Size the wrapper <div> with style or className:
By default, the Plot component exported by this library loads a precompiled version of all of plotly.js, so plotly.js must be installed as a peer dependency. This bundle is around 6Mb unminified, and minifies to just over 2Mb.
If you do not wish to use this version of plotly.js, e.g. if you want to use a different precompiled bundle or if your wish to assemble you own customized bundle, or if you wish to load plotly.js from a CDN, you can skip the installation of as a peer dependency (and ignore the resulting warning) and use the createPlotComponent method to get a Plot component, instead of importing it:
// simplest method: uses precompiled complete bundle from `plotly.js`
import Plot from 'react-plotly.js';

// customizable method: use your own `Plotly` object
import createPlotlyComponent from 'react-plotly.js/factory';
const Plot = createPlotlyComponent(Plotly);
Loading from a <script> tag
For quick one-off demos in JSFiddle or similar environments, you can load the component directly as a script tag. We don't host the bundle ourselves, so don't rely on this in production, but you can pull it from a CDN such as unpkg or jsdelivr:
How active is development on plotly/react-plotly.js?
The most recent commit recorded on plotly/react-plotly.js was 15 days ago, based on the GitHub push timestamp. The repository has 138 forks — one of the better signals of community interest.
How does plotly/react-plotly.js compare to other Data projects?
plotly/react-plotly.js is tracked by TopGit in the Data category, with 1.1k GitHub stars and written in JavaScript. Browse the Data topic page on TopGit to compare it against similar projects by stars and activity.
How many stars does plotly/react-plotly.js have?
plotly/react-plotly.js has 1.1k GitHub stars — refresh the page for the live number, or check github.com/plotly/react-plotly.js. TopGit mirrors GitHub's count but does not claim minute-by-minute accuracy.
Is plotly/react-plotly.js open source?
Yes — plotly/react-plotly.js ships under the MIT license, which makes its source code freely readable (and, depending on license terms, forkable and reusable). Source: github.com/plotly/react-plotly.js.
What is plotly/react-plotly.js?
plotly/react-plotly.js (plotly/react-plotly.js) is a JavaScript project on GitHub. From the project's own README: A plotly.js React component from Plotly 📈
Where do I read more about plotly/react-plotly.js?
This TopGit page is a snapshot — the READ ME tab shows the project's own README content (links stripped, images preserved). The GitHub repository at github.com/plotly/react-plotly.js is the definitive source.
Read full README in the tab above.
Want a second opinion on react-plotly.js?
Ask an AI that can read this page — one click and you get its take on react-plotly.js.