On GitHub, sqshq/sampler has picked up 14.7k stars, Developer Tools, Go. Tool for shell commands execution, visualization and alerting. Configured with a simple YAML file.
Snapshot summary built from the project's own GitHub metadata — there's no written TopGit review yet. The page will update automatically when a full review is published.
WHY NO REVIEW YET
TopGit writes full reviews for the most-starred, most-requested repositories. This page is a snapshot until then — see the READ ME tab for the original README in full.
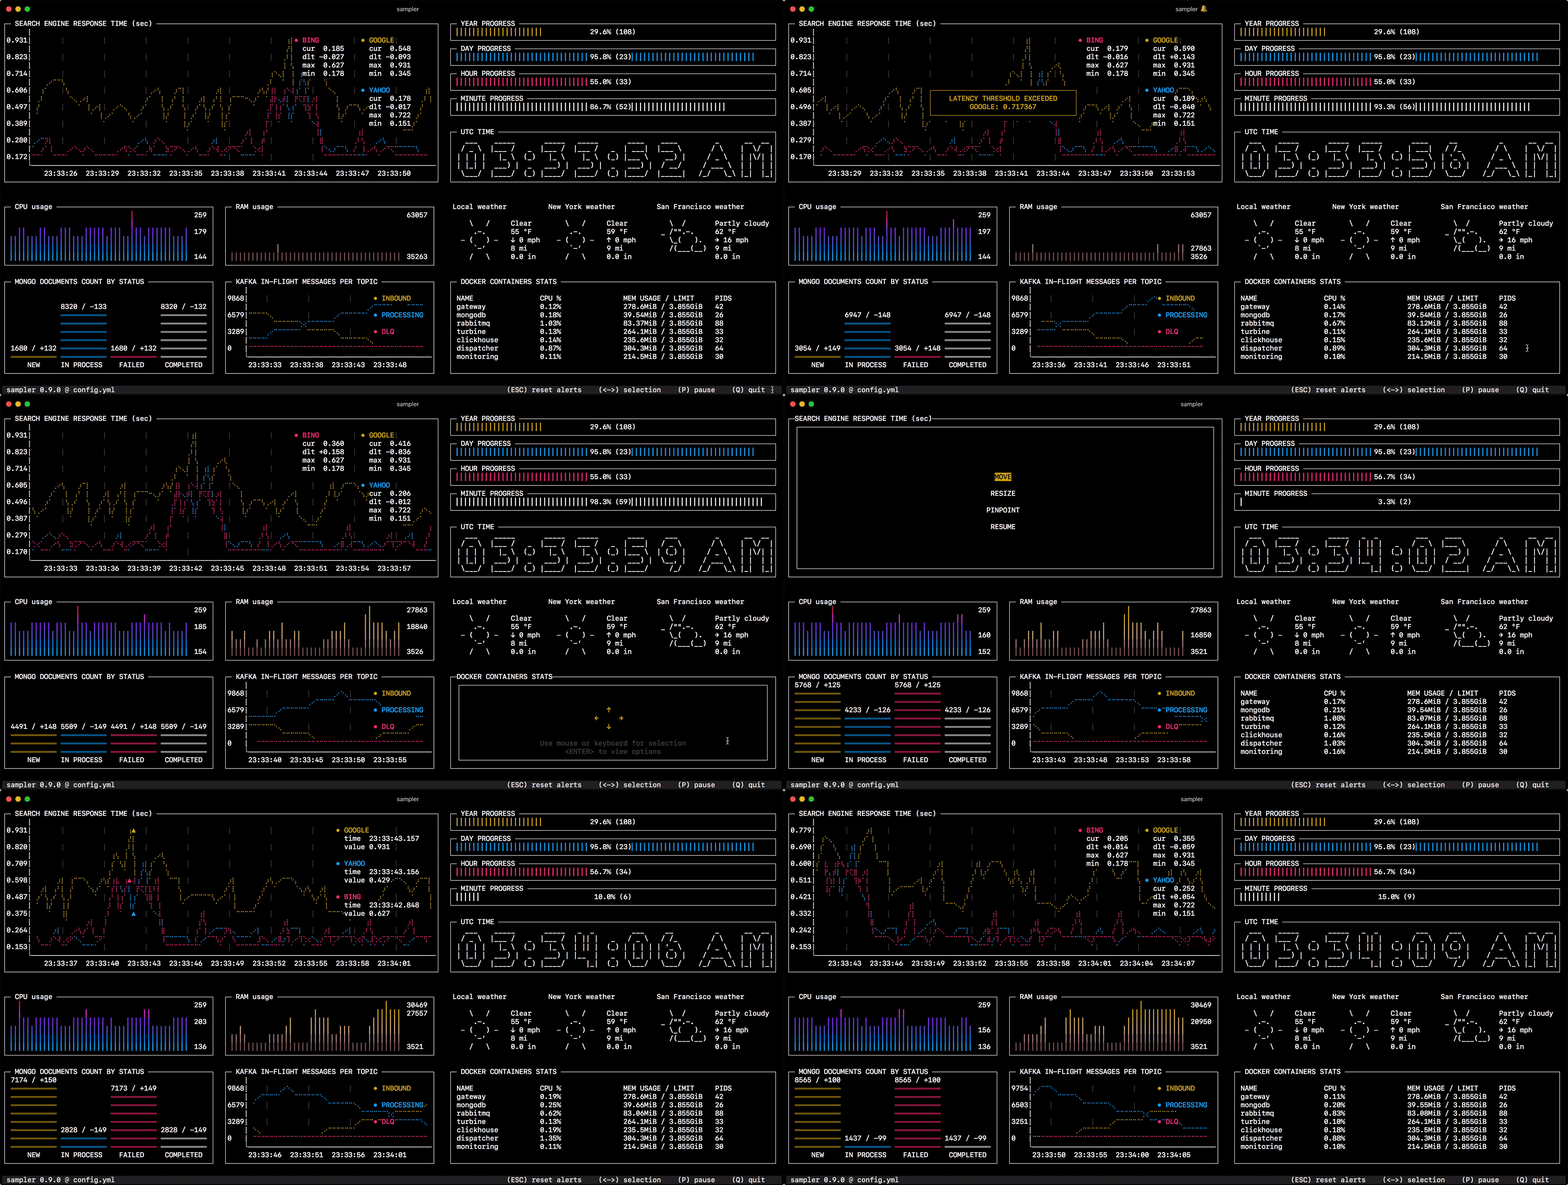
Sampler is a tool for shell commands execution, visualization and alerting. Configured with a simple YAML file.
Why do I need it?
One can sample any dynamic process right from the terminal — observe changes in the database, monitor MQ in-flight messages, trigger a deployment script and get notification when it's done.
If there is a way to get a metric using a shell command, then it can be visualized with Sampler momentarily.
Note: libasound2-dev system library is required to be installed for Sampler to play a trigger sound tone. Usually the library is in place, but if not - you can install it with your favorite package manager, e.g apt install libasound2-dev
Recommended to use with advanced console emulators, e.g. Cmder
Via Chocolatey
choco install sampler
or
Download .exe
Docker
# Create a configuration file
vim config.yml

# Build the container image
docker build --tag sampler .

# Run a container
docker run --interactive --tty --volume $(pwd)/config.yml:/root/config.yml sampler --config /root/config.yml
Usage
You specify shell commands, Sampler executes them with a required rate. The output is used for visualization.
Using Sampler is basically a 3-step process:
Define your shell commands in a YAML configuration file
Run sampler -c config.yml
Adjust components size and location on UI
But there are so many monitoring systems already
Sampler is by no means an alternative to full-scale monitoring systems, but rather an easy to setup development tool.
If spinning up and configuring Prometheus with Grafana is complete overkill for you task, Sampler might be the right solution. No servers, no databases, no deploy - you specify shell commands, and it just works.
Then it should be installed on every server I monitor?
No, you can run Sampler on local, but still gather telemetry from multiple remote machines. Any visualization might have init command, where you can ssh to a remote server. See the SSH example
Contents
Components
Runchart
Sparkline
Barchart
Gauge
Textbox
Asciibox
Bells and whistles
Triggers (conditional actions)
Interactive shell (database interaction, remote server access, etc)
Variables
Color theme
Real-world recipes (contributions welcome!)
Databases (MySQL, PostgreSQL, MongoDB, Neo4j)
Kafka
Docker
SSH
JMX
Components
The following is a list of configuration examples for each component type, with macOS compatible sampling scripts.
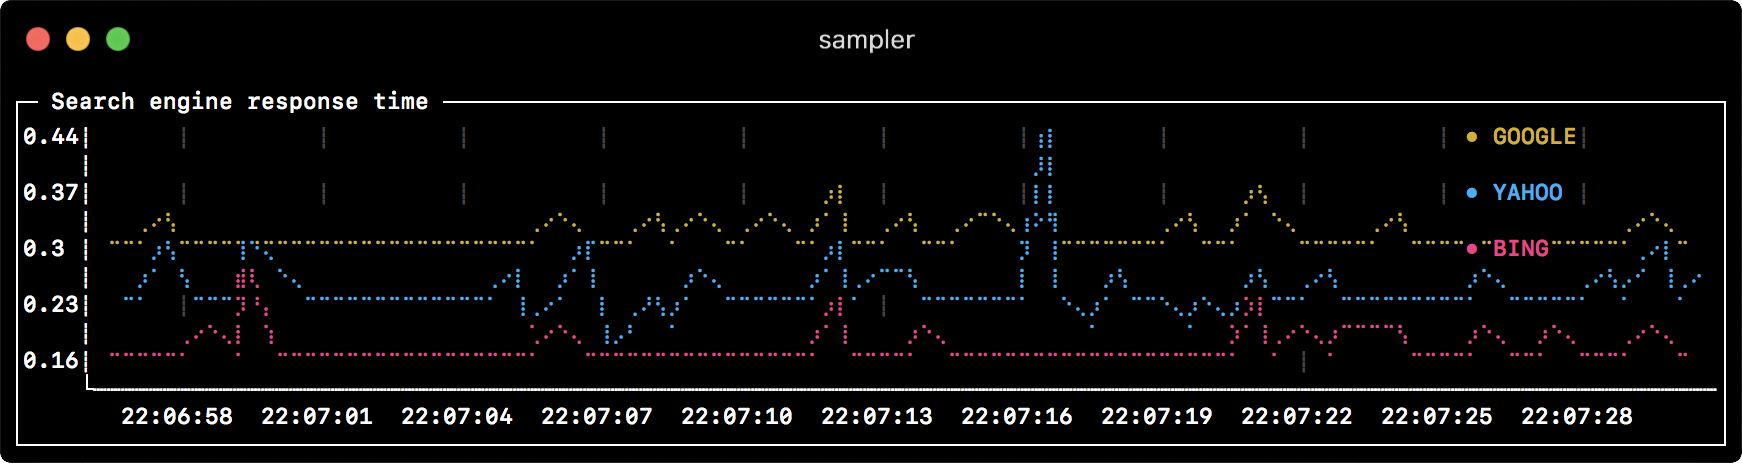
Runchart
runcharts:
  - title: Search engine response time
    rate-ms: 500        # sampling rate, default = 1000
    scale: 2            # number of digits after sample decimal point, default = 1
    legend:
      enabled: true     # enables item labels, default = true
      details: false    # enables item statistics: cur/min/max/dlt values, default = true
    items:
      - label: GOOGLE
        sample: curl -o /dev/null -s -w '%{time_total}'  https://www.google.com
        color: 178      # 8-bit color number, default one is chosen from a pre-defined palette
      - label: YAHOO
        sample: curl -o /dev/null -s -w '%{time_total}'  https://search.yahoo.com
      - label: BING
        sample: curl -o /dev/null -s -w '%{time_total}'  https://www.bing.com
barcharts:
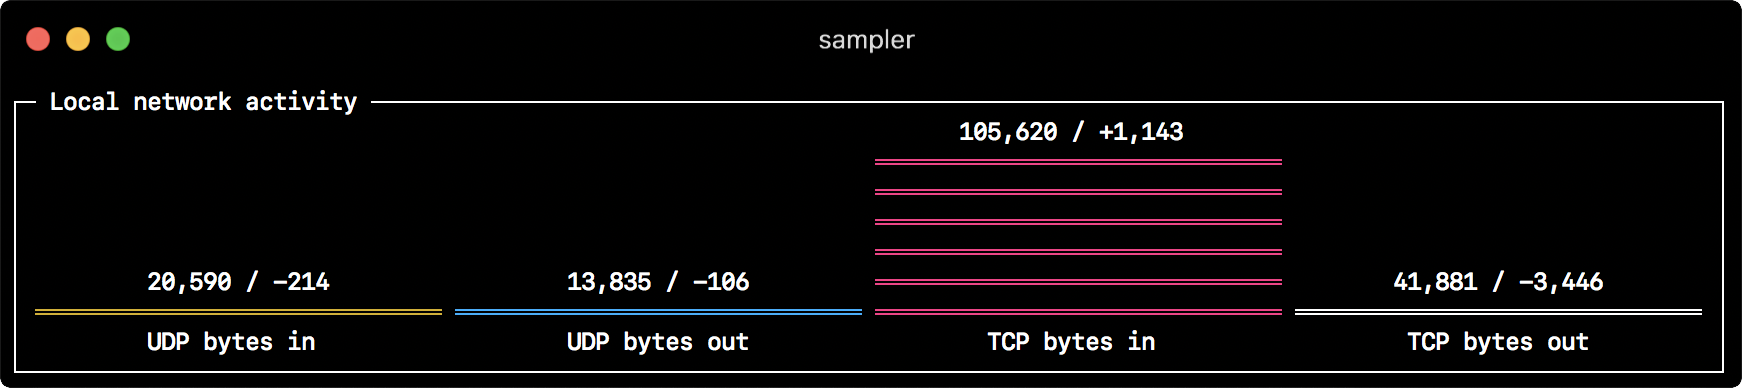
  - title: Local network activity
    rate-ms: 500        # sampling rate, default = 1000
    scale: 0            # number of digits after sample decimal point, default = 1
    items:
      - label: UDP bytes in
        sample: nettop -J bytes_in -l 1 -m udp | awk '{sum += $4} END {print sum}'
      - label: UDP bytes out
        sample: nettop -J bytes_out -l 1 -m udp | awk '{sum += $4} END {print sum}'
      - label: TCP bytes in
        sample: nettop -J bytes_in -l 1 -m tcp | awk '{sum += $4} END {print sum}'
      - label: TCP bytes out
        sample: nettop -J bytes_out -l 1 -m tcp | awk '{sum += $4} END {print sum}'
Gauge
gauges:
  - title: Minute progress
    rate-ms: 500        # sampling rate, default = 1000
    scale: 2            # number of digits after sample decimal point, default = 1
    percent-only: false # toggle display of the current value, default = false
    color: 178          # 8-bit color number, default one is chosen from a pre-defined palette
    cur:
      sample: date +%S  # sample script for current value
    max:
      sample: echo 60   # sample script for max value
    min:
      sample: echo 0    # sample script for min value
  - title: Year progress
    cur:
      sample: date +%j
    max:
      sample: echo 365
    min:
      sample: echo 0
Textbox
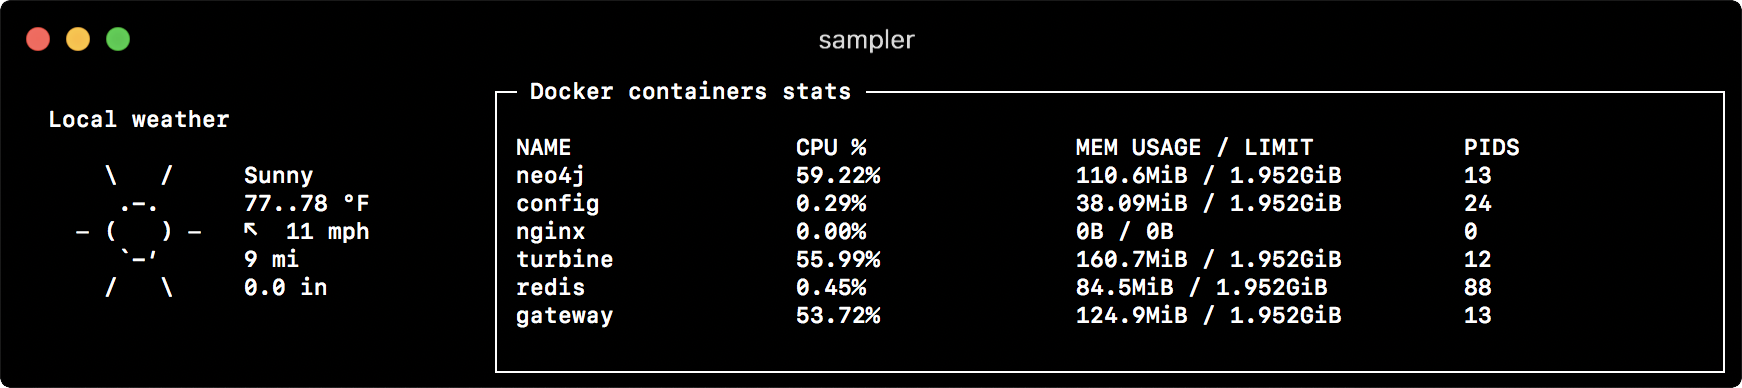
textboxes:
  - title: Local weather
    rate-ms: 10000      # sampling rate, default = 1000
    sample: curl wttr.in?0ATQF
    border: false       # border around the item, default = true
    color: 178          # 8-bit color number, default is white
  - title: Docker containers stats
    rate-ms: 500
    sample: docker stats --no-stream --format "table {{.Name}}\t{{.CPUPerc}}\t{{.MemUsage}}\t{{.PIDs}}"
Asciibox
asciiboxes:
  - title: UTC time
    rate-ms: 500        # sampling rate, default = 1000
    font: 3d            # font type, default = 2d
    border: false       # border around the item, default = true
    color: 43           # 8-bit color number, default is white
    sample: env TZ=UTC date +%r
Bells and whistles
Triggers
Triggers allow to perform conditional actions, like visual/sound alerts or an arbitrary shell command.
The following examples illustrate the concept.
Clock gauge, which shows minute progress and announces current time at the beginning of each minute
gauges:
  - title: MINUTE PROGRESS
    position: [[0, 18], [80, 0]]
    cur:
      sample: date +%S
    max:
      sample: echo 60
    min:
      sample: echo 0
    triggers:
      - title: CLOCK BELL EVERY MINUTE
        condition: '[ $label == "cur" ] && [ $cur -eq 0 ] && echo 1 || echo 0'  # expects "1" as TRUE indicator
        actions:
          terminal-bell: true  # standard terminal bell, default = false
          sound: true    # NASA quindar tone, default = false
          visual: false  # notification with current value on top of the component area, default = false
          script: say -v samantha `date +%I:%M%p`  # an arbitrary script, which can use $cur, $prev and $label variables
Search engine latency chart, which alerts user when latency exceeds a threshold
runcharts:
  - title: SEARCH ENGINE RESPONSE TIME (sec)
    rate-ms: 200
    items:
      - label: GOOGLE
        sample: curl -o /dev/null -s -w '%{time_total}'  https://www.google.com
      - label: YAHOO
        sample: curl -o /dev/null -s -w '%{time_total}'  https://search.yahoo.com
    triggers:
      - title: Latency threshold exceeded
        condition: echo "$prev < 0.3 && $cur > 0.3" |bc -l  # expects "1" as TRUE indicator
        actions:
          terminal-bell: true  # standard terminal bell, default = false
          sound: true   # NASA quindar tone, default = false
          visual: true  # visual notification on top of the component area, default = false
          script: 'say alert: ${label} latency exceeded ${cur} second' # an arbitrary script, which can use $cur, $prev and $label variables
Interactive shell support
In addition to the sample command, one can specify init command (executed only once before sampling) and transform command (to post-process sample command output). That covers interactive shell use case, e.g. to establish connection to a database only once, and then perform polling within interactive shell session.
Basic mode
textboxes:
  - title: MongoDB polling
    rate-ms: 500
    init: mongo --quiet --host=localhost test # executes only once to start the interactive session
    sample: Date.now();                       # executes with a required rate, in scope of the interactive session
    transform: echo result = $sample          # executes in scope of local session, $sample variable is available for transformation
PTY mode
In some cases interactive shell won't work, because its stdin is not a terminal. We can fool it, using PTY mode:
It is also possible to execute multiple init commands one after another, before you start sampling.
textboxes:
  - title: Java application uptime
    multistep-init:
      - java -jar jmxterm-1.0.0-uber.jar
      - open host:port # or local PID
      - bean java.lang:type=Runtime
    sample: get Uptime
Variables
If the configuration file contains repeated patterns, they can be extracted into the variables section.
Also variables can be specified using -v/--variable flag on startup, and any system environment variables will also be available in the scripts.
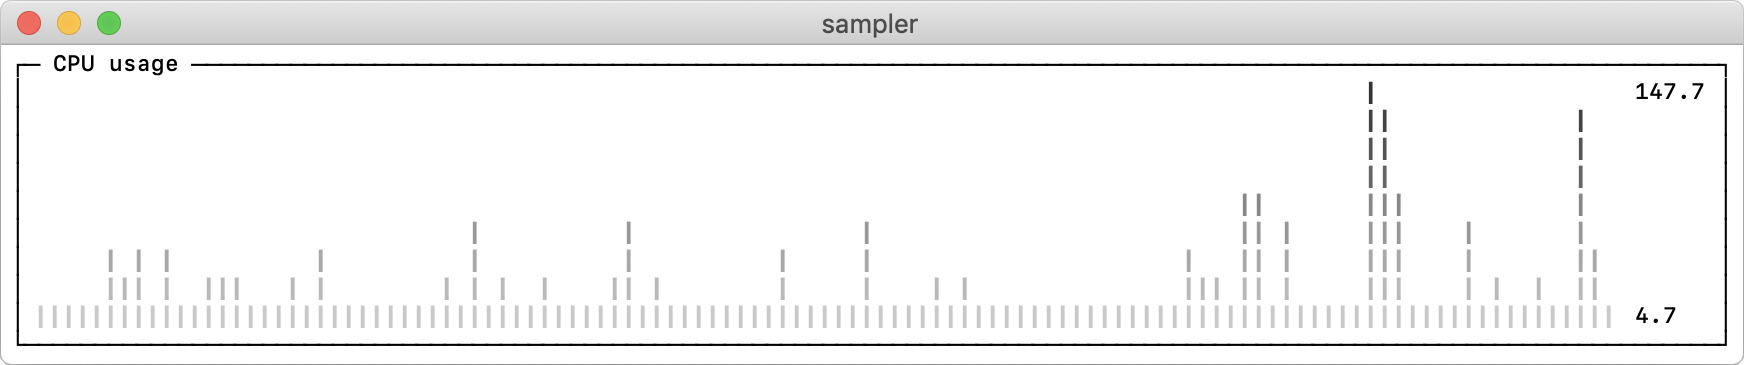
theme: light # default = dark
sparklines:
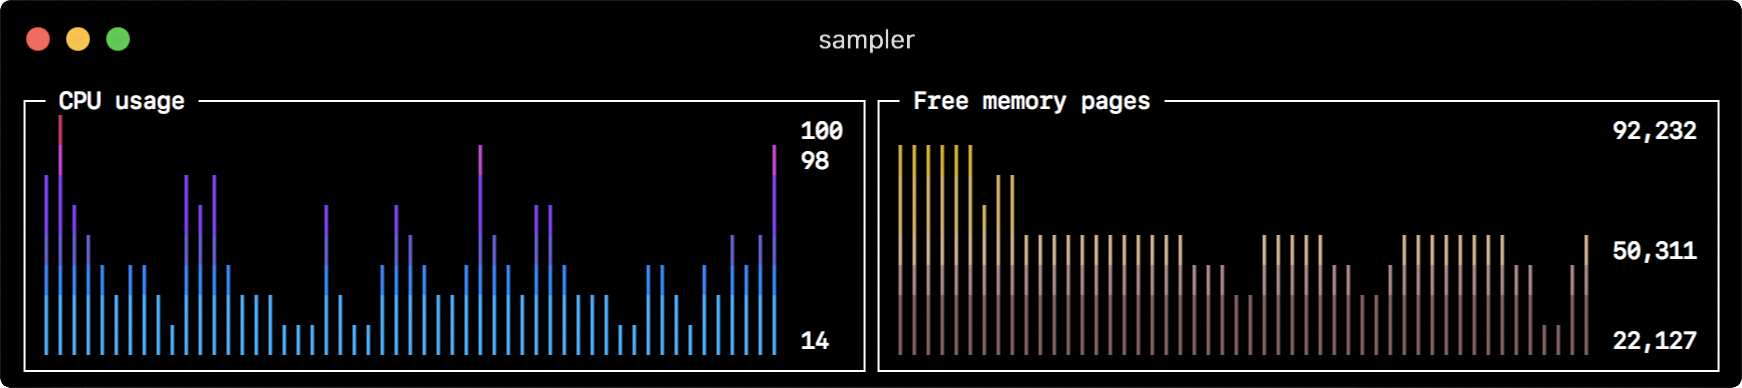
  - title: CPU usage
    sample: ps -A -o %cpu | awk '{s+=$1} END {print s}'
Real-world recipes
Databases
The following are different database connection examples. Interactive shell (init script) usage is recommended to establish connection only once and then reuse it during sampling.
MySQL
# prerequisite: installed mysql shell

variables:
  mysql_connection: mysql -u root -s --database mysql --skip-column-names
sparklines:
  - title: MySQL (random number example)
    pty: true
    init: $mysql_connection
    sample: select rand();
The most recent commit recorded on sqshq/sampler was 2.5 years ago, based on the GitHub push timestamp. The repository has 666 forks — one of the better signals of community interest.
How many stars does sqshq/sampler have?
sqshq/sampler has 14.7k GitHub stars — refresh the page for the live number, or check github.com/sqshq/sampler. TopGit mirrors GitHub's count but does not claim minute-by-minute accuracy.
Is sqshq/sampler open source?
Yes — sqshq/sampler ships under the GPL-3.0 license, which makes its source code freely readable (and, depending on license terms, forkable and reusable). Source: github.com/sqshq/sampler.
What else is in the Developer Tools space?
sqshq/sampler is tracked by TopGit under the Developer Tools category, alongside 12 GitHub-tagged topics. Trending and Topics pages list peer repositories of comparable stars and language.
The project maintains a homepage at https://sampler.dev. The README tab on this page also usually contains screenshots and a quickstart.
Where do I read more about sqshq/sampler?
This TopGit page is a snapshot — the READ ME tab shows the project's own README content (links stripped, images preserved). The GitHub repository at github.com/sqshq/sampler is the definitive source.
Read full README in the tab above.
Still deciding about sampler?
One click hands the question to an AI along with this page — see what it says about sampler.