Indexed by TopGit from live GitHub metadata: stefanprodan/dockprom has 6.6k stars. Docker hosts and containers monitoring with Prometheus, Grafana, cAdvisor, NodeExporter and AlertManager
Snapshot summary built from the project's own GitHub metadata — there's no written TopGit review yet. The page will update automatically when a full review is published.
WHY NO REVIEW YET
TopGit writes full reviews for the most-starred, most-requested repositories. This page is a snapshot until then — see the READ ME tab for the original README in full.
A monitoring solution for Docker hosts and containers with Prometheus, Grafana, cAdvisor,
NodeExporter and alerting with AlertManager.
Install
Clone this repository on your Docker host, cd into dockprom directory and run compose up:
git clone https://github.com/stefanprodan/dockprom
cd dockprom

ADMIN_USER='admin' ADMIN_PASSWORD='admin' ADMIN_PASSWORD_HASH='$2a$14$1l.IozJx7xQRVmlkEQ32OeEEfP5mRxTpbDTCTcXRqn19gXD8YK1pO' docker-compose up -d
Caddy v2 does not accept plaintext passwords. It MUST be provided as a hash value. The above password hash corresponds to ADMIN_PASSWORD 'admin'. To know how to generate hash password, refer Updating Caddy to v2
Prerequisites:
Docker Engine >= 1.13
Docker Compose >= 1.11
Updating Caddy to v2
Perform a docker run --rm caddy caddy hash-password --plaintext 'ADMIN_PASSWORD' in order to generate a hash for your new password.
ENSURE that you replace ADMIN_PASSWORD with new plain text password and ADMIN_PASSWORD_HASH with the hashed password references in docker-compose.yml for the caddy container.
Caddy (reverse proxy and basic auth provider for prometheus and alertmanager)
Setup Grafana
Navigate to http://<host-ip>:3000 and login with user admin password admin. You can change the credentials in the compose file or by supplying the ADMIN_USER and ADMIN_PASSWORD environment variables on compose up. The config file can be added directly in grafana part like this
If you want to change the password, you have to remove this entry, otherwise the change will not take effect
- grafana_data:/var/lib/grafana
Grafana is preconfigured with dashboards and Prometheus as the default data source:
Name: Prometheus
Type: Prometheus
Url: http://prometheus:9090
Access: proxy
Docker Host Dashboard
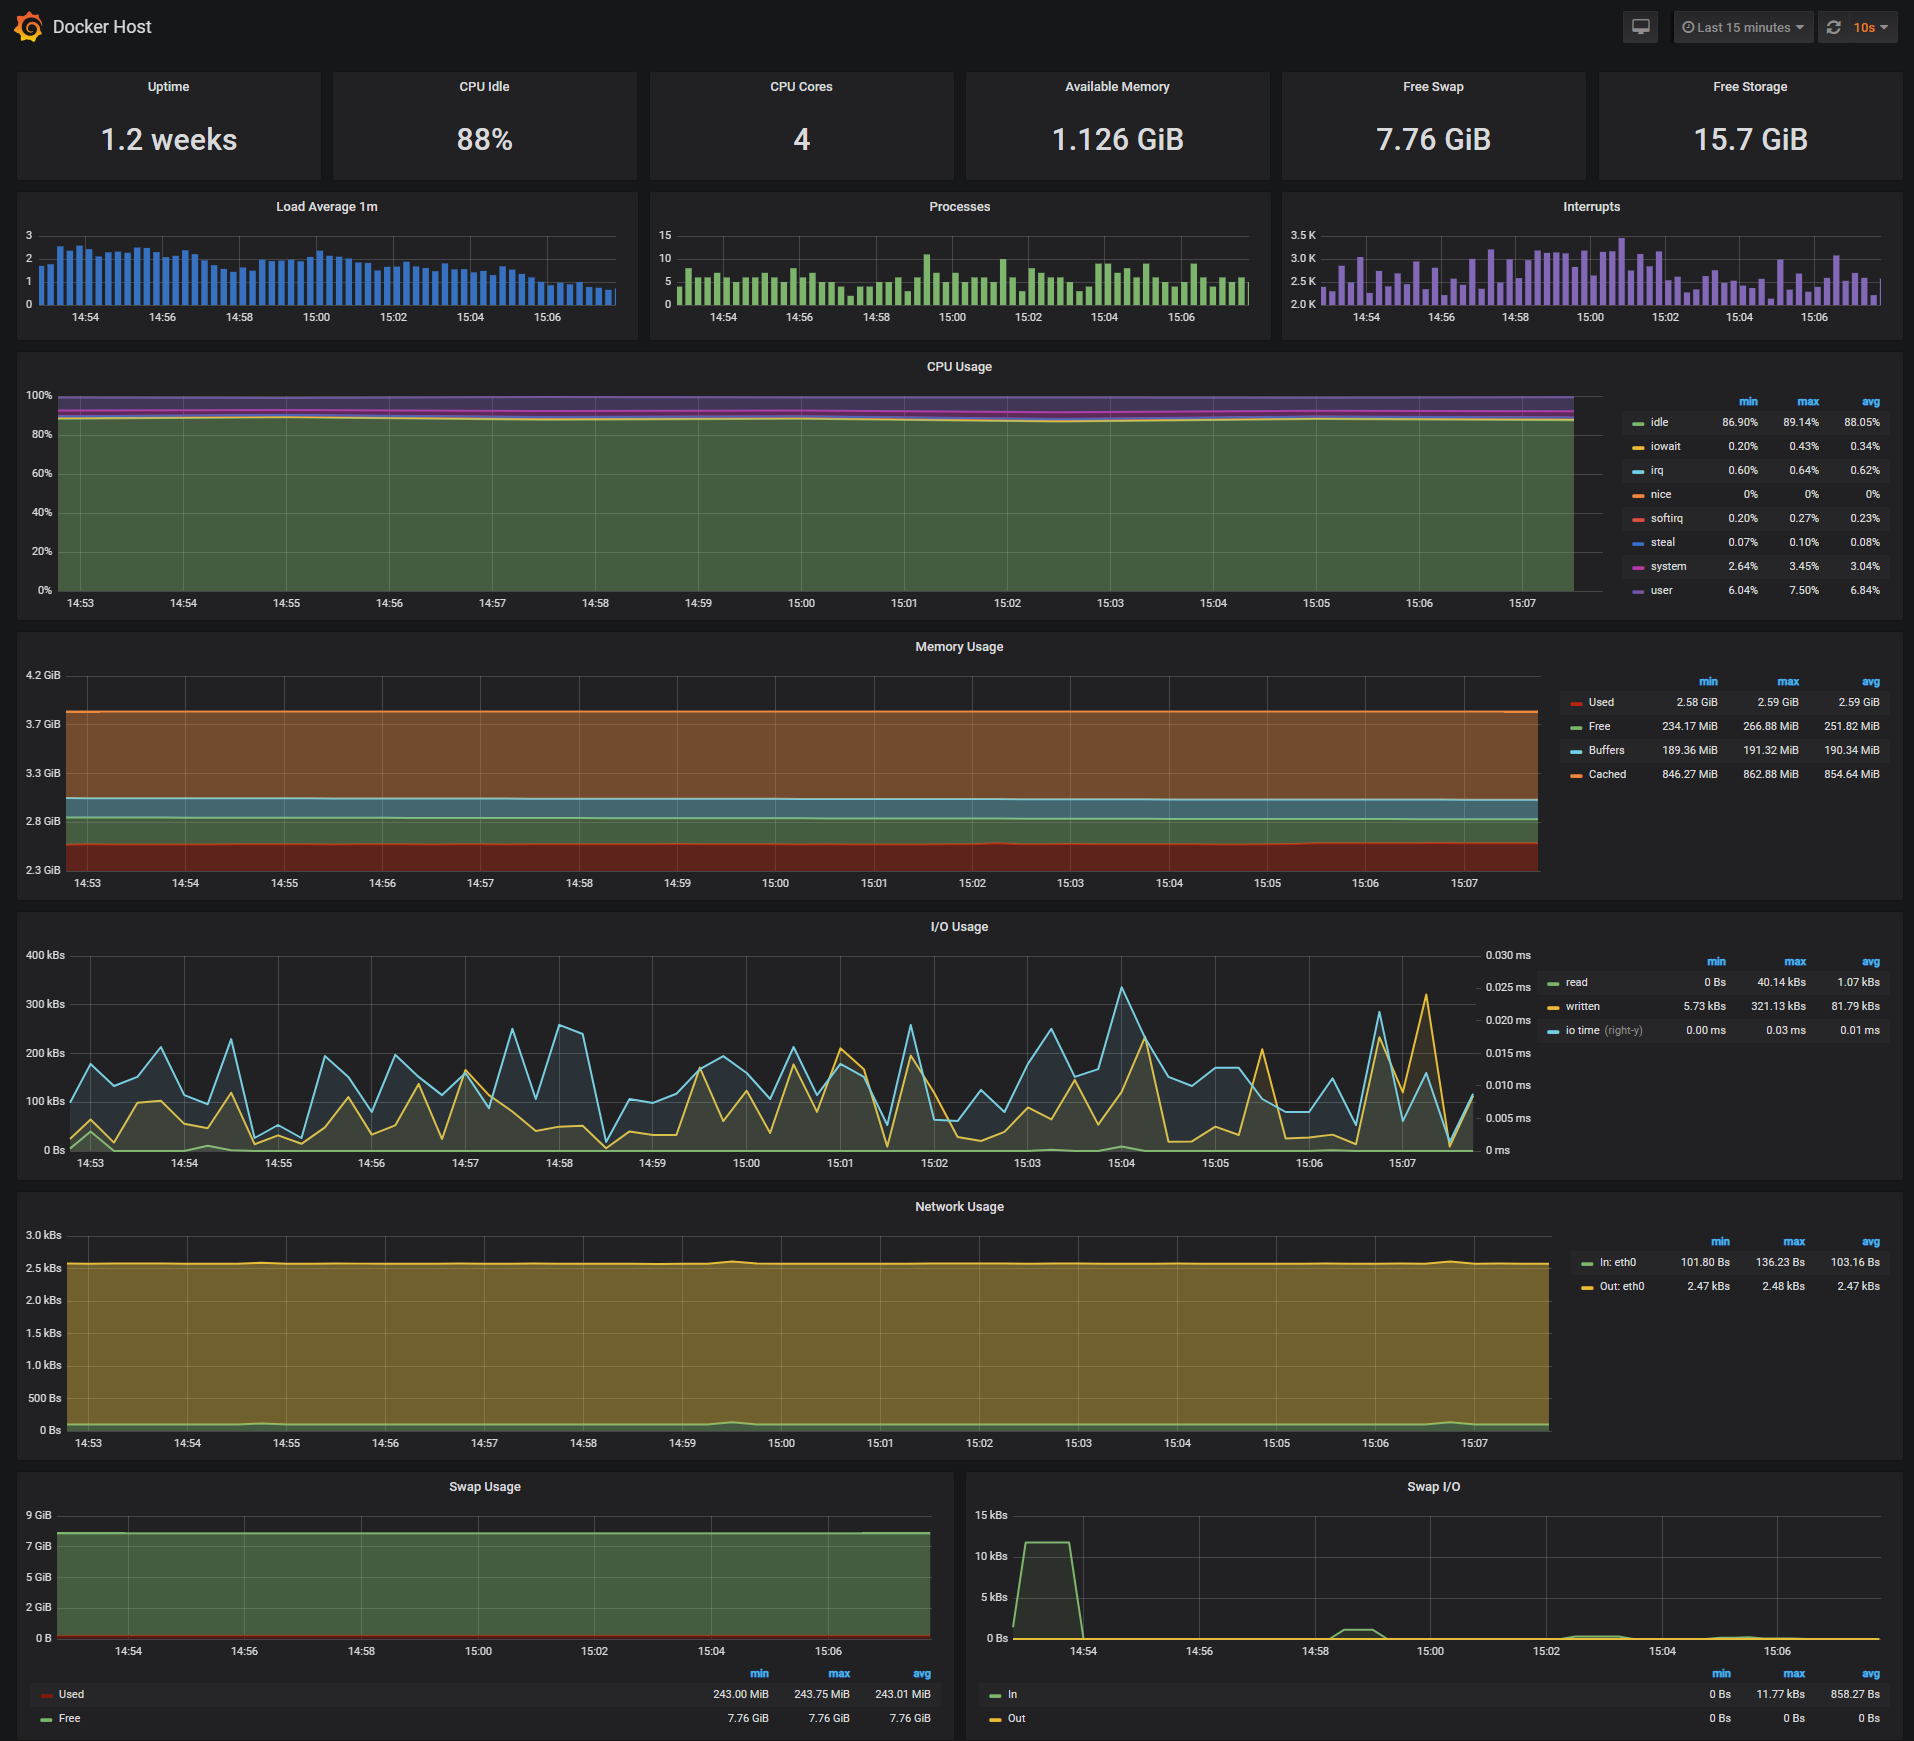
The Docker Host Dashboard shows key metrics for monitoring the resource usage of your server:
Server uptime, CPU idle percent, number of CPU cores, available memory, swap and storage
System load average graph, running and blocked by IO processes graph, interrupts graph
CPU usage graph by mode (guest, idle, iowait, irq, nice, softirq, steal, system, user)
Memory usage graph by distribution (used, free, buffers, cached)
IO usage graph (read Bps, read Bps and IO time)
Network usage graph by device (inbound Bps, Outbound Bps)
Swap usage and activity graphs
For storage and particularly Free Storage graph, you have to specify the fstype in grafana graph request.
You can find it in grafana/provisioning/dashboards/docker_host.json, at line 480 :
I work on BTRFS, so i need to change aufs to btrfs.
You can find right value for your system in Prometheus http://<host-ip>:9090 launching this request :
node_filesystem_free_bytes
Docker Containers Dashboard
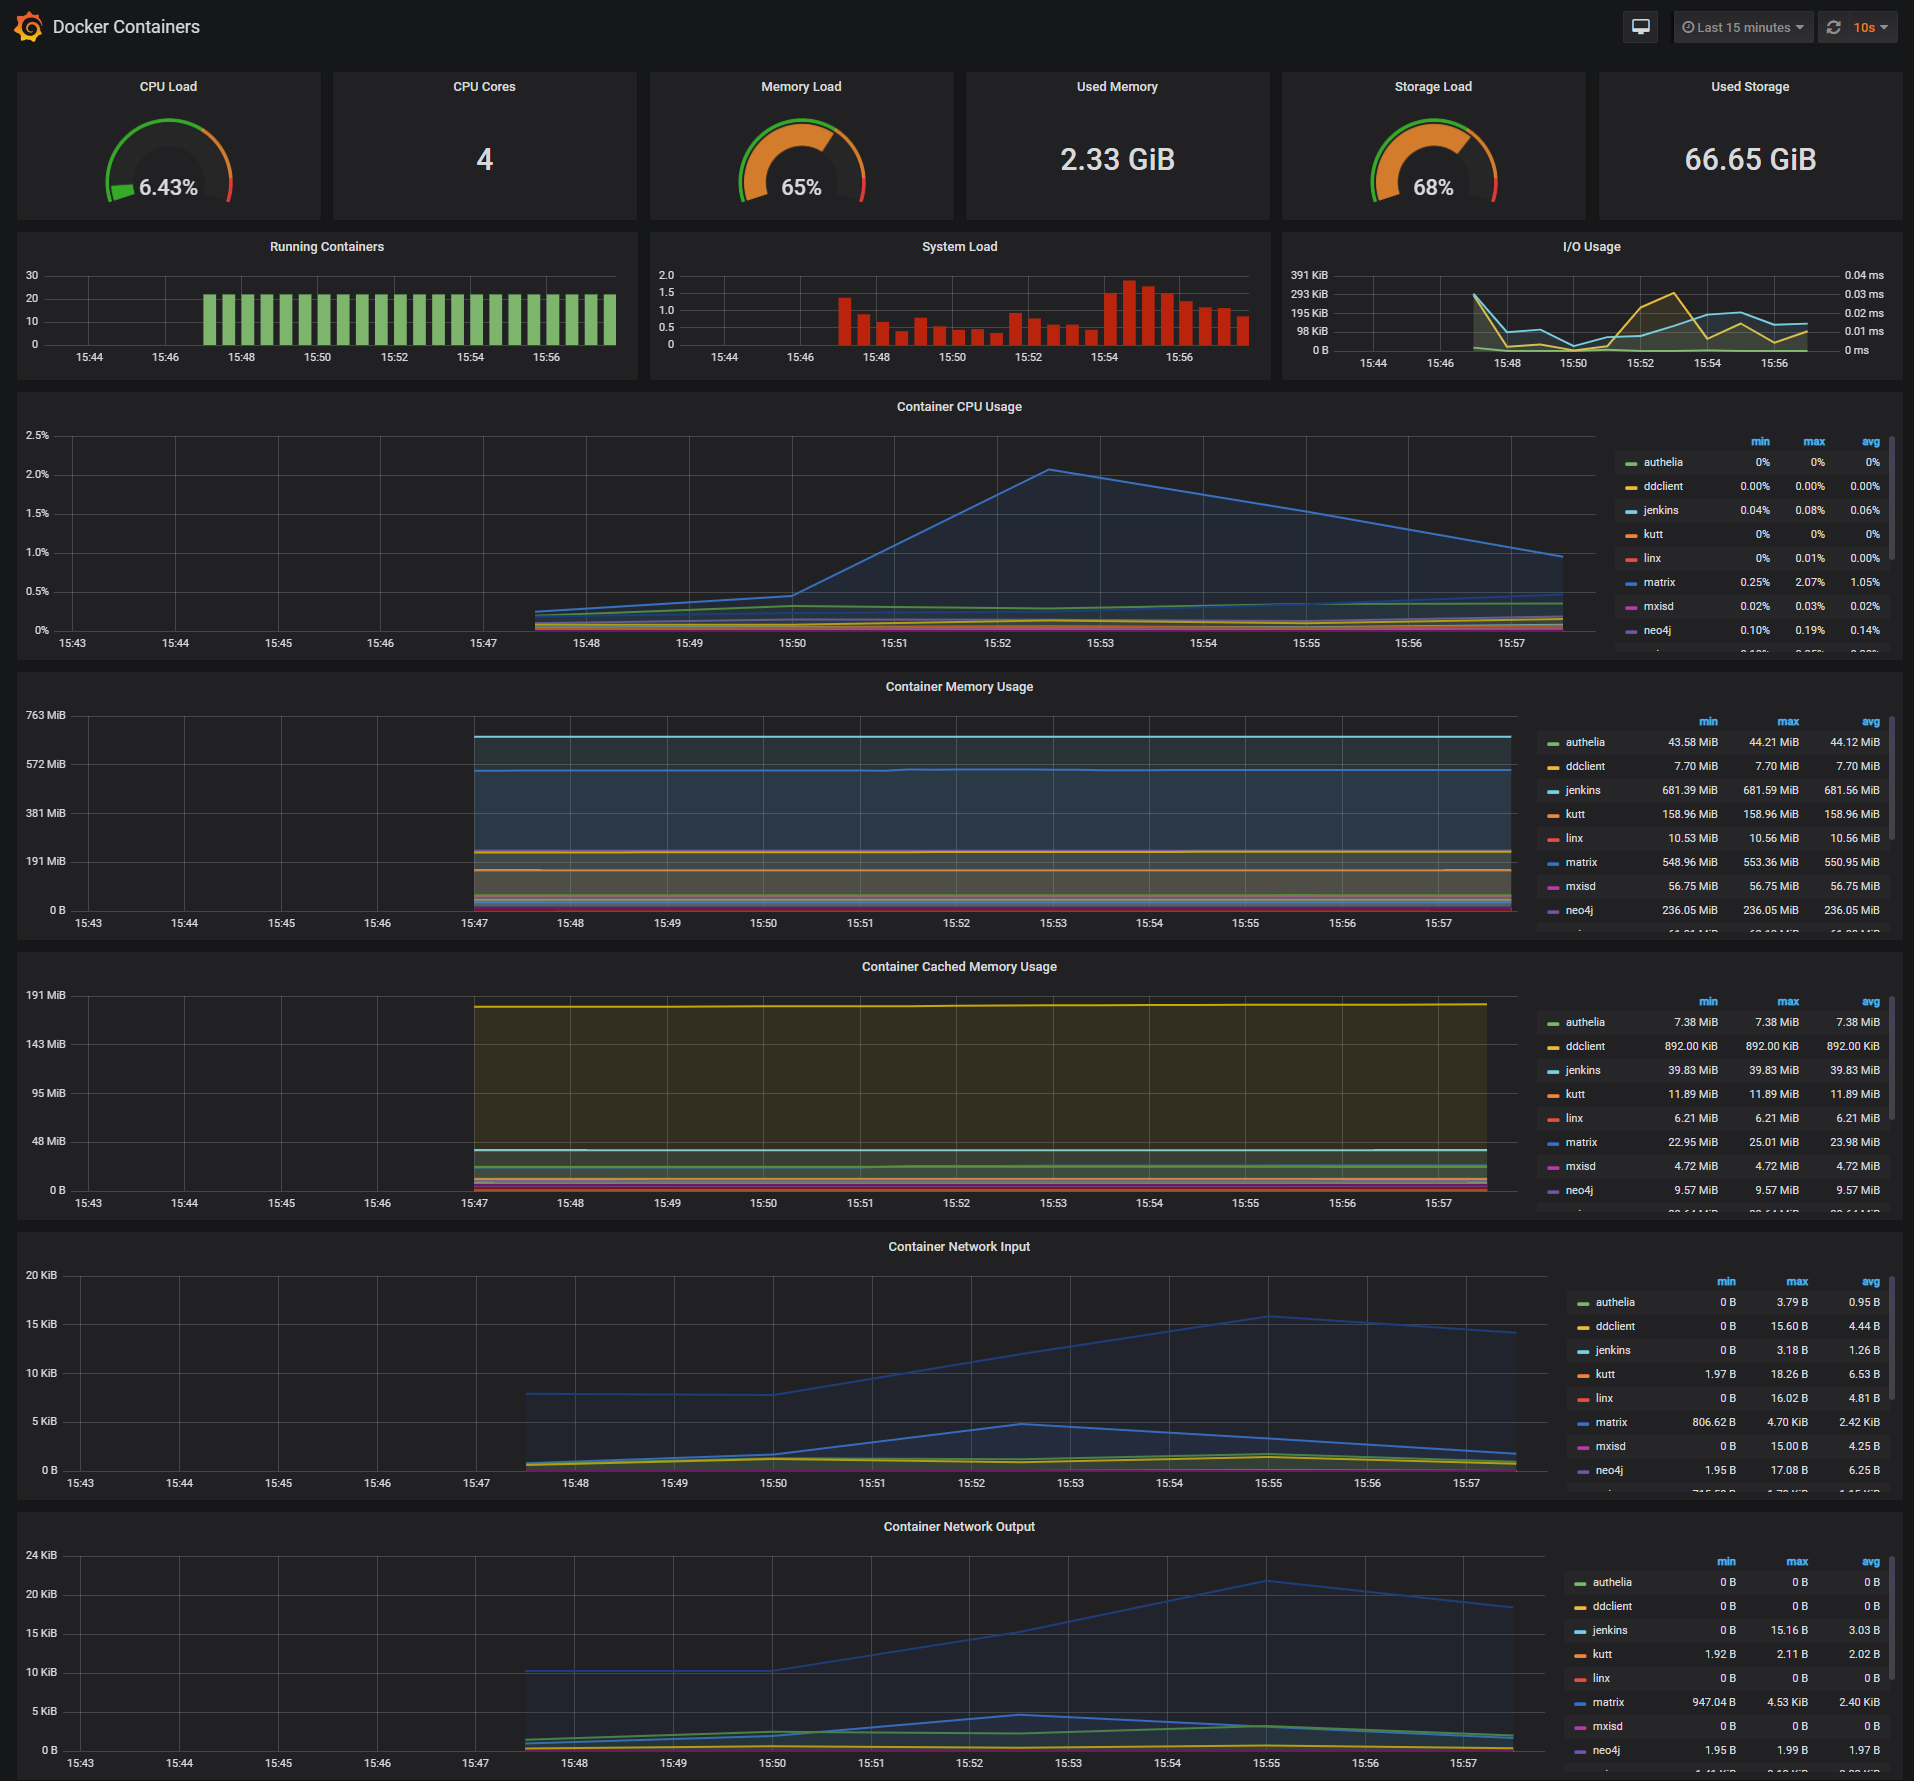
The Docker Containers Dashboard shows key metrics for monitoring running containers:
Total containers CPU load, memory and storage usage
Running containers graph, system load graph, IO usage graph
Container CPU usage graph
Container memory usage graph
Container cached memory usage graph
Container network inbound usage graph
Container network outbound usage graph
Note that this dashboard doesn't show the containers that are part of the monitoring stack.
For storage and particularly Storage Load graph, you have to specify the fstype in grafana graph request.
You can find it in grafana/provisioning/dashboards/docker_containers.json, at line 406 :
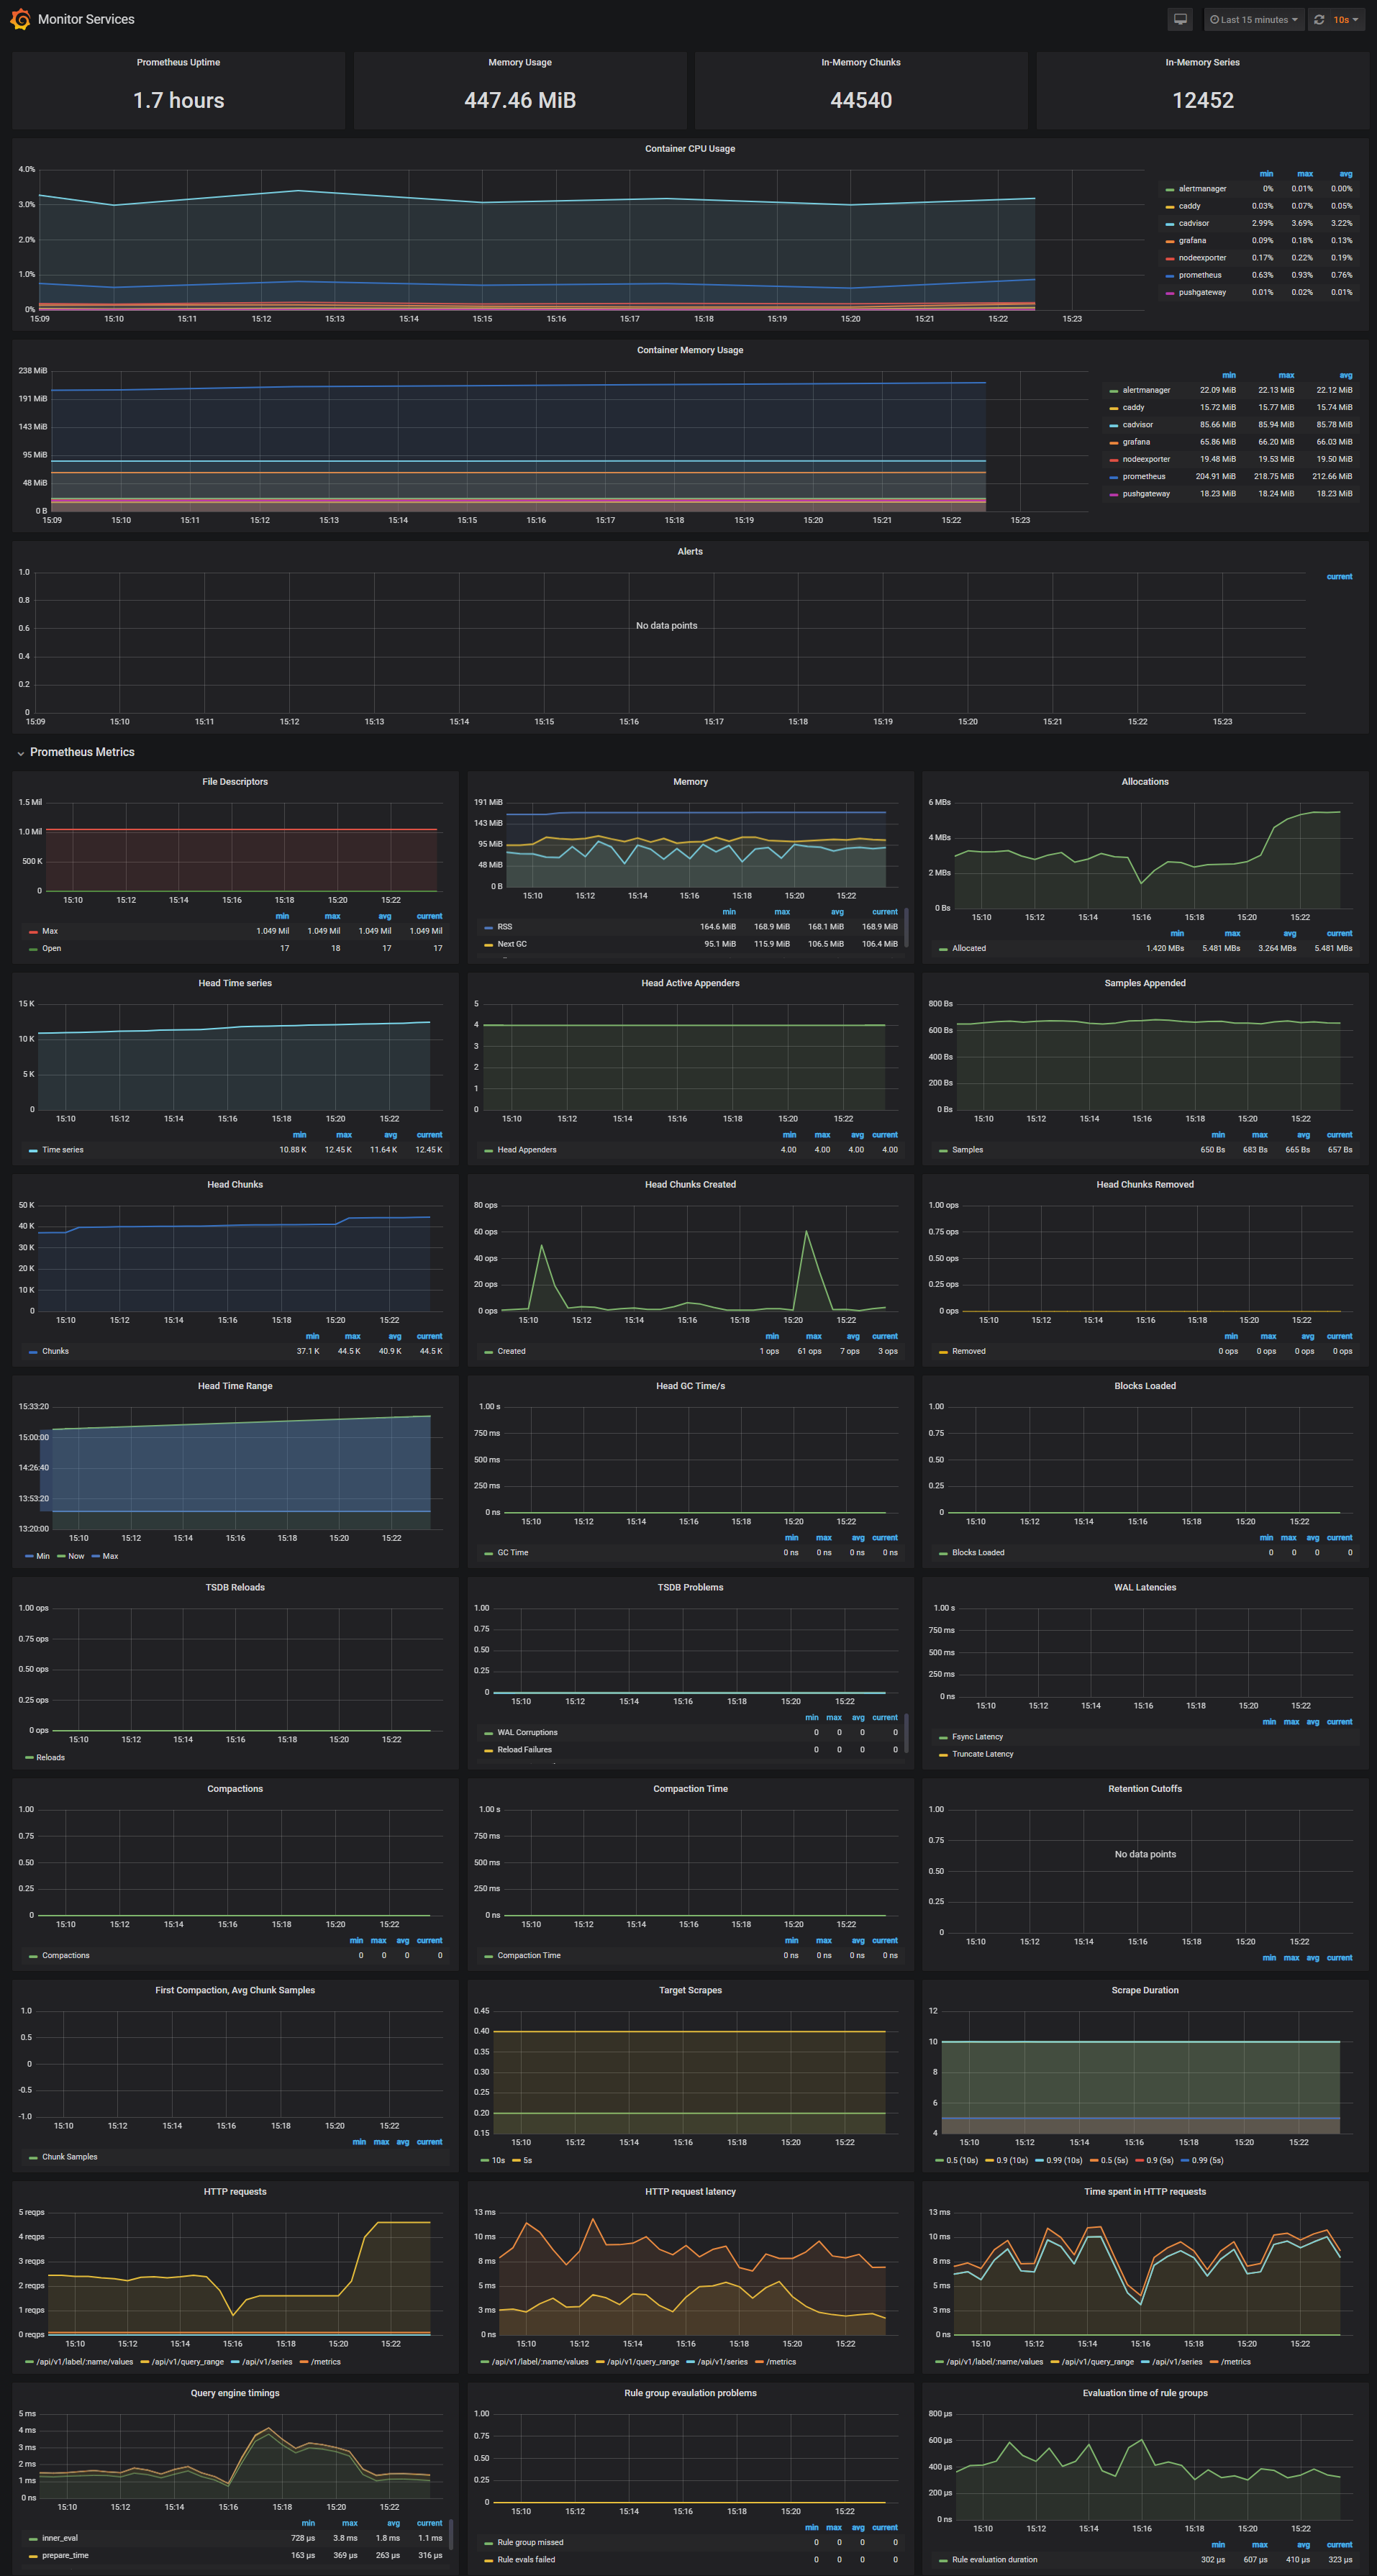
The Monitor Services Dashboard shows key metrics for monitoring the containers that make up the monitoring stack:
Prometheus container uptime, monitoring stack total memory usage, Prometheus local storage memory chunks and series
Container CPU usage graph
Container memory usage graph
Prometheus chunks to persist and persistence urgency graphs
Prometheus chunks ops and checkpoint duration graphs
Prometheus samples ingested rate, target scrapes and scrape duration graphs
Prometheus HTTP requests graph
Prometheus alerts graph
Define alerts
Three alert groups have been setup within the alert.rules configuration file:
Monitoring services alerts targets
Docker Host alerts host
Docker Containers alerts containers
You can modify the alert rules and reload them by making a HTTP POST call to Prometheus:
curl -X POST http://admin:admin@<host-ip>:9090/-/reload
Monitoring services alerts
Trigger an alert if any of the monitoring targets (node-exporter and cAdvisor) are down for more than 30 seconds:
- alert: monitor_service_down
    expr: up == 0
    for: 30s
    labels:
      severity: critical
    annotations:
      summary: "Monitor service non-operational"
      description: "Service {{ $labels.instance }} is down."
Docker Host alerts
Trigger an alert if the Docker host CPU is under high load for more than 30 seconds:
- alert: high_cpu_load
    expr: node_load1 > 1.5
    for: 30s
    labels:
      severity: warning
    annotations:
      summary: "Server under high load"
      description: "Docker host is under high load, the avg load 1m is at {{ $value}}. Reported by instance {{ $labels.instance }} of job {{ $labels.job }}."
Modify the load threshold based on your CPU cores.
Trigger an alert if the Docker host memory is almost full:
- alert: high_memory_load
    expr: (sum(node_memory_MemTotal_bytes) - sum(node_memory_MemFree_bytes + node_memory_Buffers_bytes + node_memory_Cached_bytes) ) / sum(node_memory_MemTotal_bytes) * 100 > 85
    for: 30s
    labels:
      severity: warning
    annotations:
      summary: "Server memory is almost full"
      description: "Docker host memory usage is {{ humanize $value}}%. Reported by instance {{ $labels.instance }} of job {{ $labels.job }}."
Trigger an alert if the Docker host storage is almost full:
- alert: high_storage_load
    expr: (node_filesystem_size_bytes{fstype="aufs"} - node_filesystem_free_bytes{fstype="aufs"}) / node_filesystem_size_bytes{fstype="aufs"}  * 100 > 85
    for: 30s
    labels:
      severity: warning
    annotations:
      summary: "Server storage is almost full"
      description: "Docker host storage usage is {{ humanize $value}}%. Reported by instance {{ $labels.instance }} of job {{ $labels.job }}."
Docker Containers alerts
Trigger an alert if a container is down for more than 30 seconds:
- alert: jenkins_down
    expr: absent(container_memory_usage_bytes{name="jenkins"})
    for: 30s
    labels:
      severity: critical
    annotations:
      summary: "Jenkins down"
      description: "Jenkins container is down for more than 30 seconds."
Trigger an alert if a container is using more than 10% of total CPU cores for more than 30 seconds:
- alert: jenkins_high_cpu
    expr: sum(rate(container_cpu_usage_seconds_total{name="jenkins"}[1m])) / count(node_cpu_seconds_total{mode="system"}) * 100 > 10
    for: 30s
    labels:
      severity: warning
    annotations:
      summary: "Jenkins high CPU usage"
      description: "Jenkins CPU usage is {{ humanize $value}}%."
Trigger an alert if a container is using more than 1.2GB of RAM for more than 30 seconds:
- alert: jenkins_high_memory
    expr: sum(container_memory_usage_bytes{name="jenkins"}) > 1200000000
    for: 30s
    labels:
      severity: warning
    annotations:
      summary: "Jenkins high memory usage"
      description: "Jenkins memory consumption is at {{ humanize $value}}."
Setup alerting
The AlertManager service is responsible for handling alerts sent by Prometheus server.
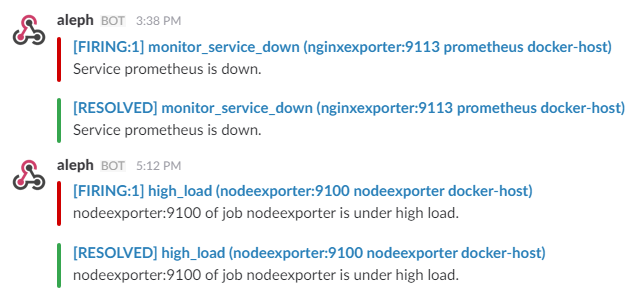
AlertManager can send notifications via email, Pushover, Slack, HipChat or any other system that exposes a webhook interface.
A complete list of integrations can be found here.
You can view and silence notifications by accessing http://<host-ip>:9093.
The notification receivers can be configured in alertmanager/config.yml file.
To receive alerts via Slack you need to make a custom integration by choose incoming web hooks in your Slack team app page.
You can find more details on setting up Slack integration here.
Copy the Slack Webhook URL into the api_url field and specify a Slack channel.
Please replace the user:password part with your user and password set in the initial configuration (default: admin:admin).
Updating Grafana to v5.2.2
In Grafana versions >= 5.1 the id of the grafana user has been changed. Unfortunately this means that files created prior to 5.1 won’t have the correct permissions for later versions.
Version
User
User ID
< 5.1
grafana
104
>= 5.1
grafana
472
There are two possible solutions to this problem.
Change ownership from 104 to 472
Start the upgraded container as user 104
Specifying a user in docker-compose.yml
To change ownership of the files run your grafana container as root and modify the permissions.
First perform a docker-compose down then modify your docker-compose.yml to include the user: root option:
How active is development on stefanprodan/dockprom?
The most recent commit recorded on stefanprodan/dockprom was 8 months ago, based on the GitHub push timestamp. The repository has 1.7k forks — one of the better signals of community interest.
How many stars does stefanprodan/dockprom have?
stefanprodan/dockprom has 6.6k GitHub stars — refresh the page for the live number, or check github.com/stefanprodan/dockprom. TopGit mirrors GitHub's count but does not claim minute-by-minute accuracy.
Is stefanprodan/dockprom open source?
Yes — stefanprodan/dockprom ships under the MIT license, which makes its source code freely readable (and, depending on license terms, forkable and reusable). Source: github.com/stefanprodan/dockprom.
What else is in the Developer Tools space?
stefanprodan/dockprom is tracked by TopGit under the Developer Tools category, alongside 6 GitHub-tagged topics. Trending and Topics pages list peer repositories of comparable stars and language.
What is stefanprodan/dockprom?
stefanprodan/dockprom (stefanprodan/dockprom) is a multi-language project on GitHub. From the project's own README: Docker hosts and containers monitoring with Prometheus, Grafana, cAdvisor, NodeExporter and AlertManager
What language is stefanprodan/dockprom written in?
TopGit's last sync did not record a primary language for stefanprodan/dockprom. Open the repository on GitHub to see the full breakdown by file extension.
What license does stefanprodan/dockprom use?
stefanprodan/dockprom is released under the MIT license. Always verify the LICENSE file directly on GitHub for the authoritative terms — license strings can be edited out of sync with a project's actual stance.
Where do I read more about stefanprodan/dockprom?
This TopGit page is a snapshot — the READ ME tab shows the project's own README content (links stripped, images preserved). The GitHub repository at github.com/stefanprodan/dockprom is the definitive source.
Read full README in the tab above.
Curious whether dockprom is right for you?
Let ChatGPT, Claude, or Perplexity look into it — click below and see what AI actually says about dockprom.

 /dockprom