antvis/AVA là một trong những repo tập trung dữ liệu mà TopGit theo dõi, hiện có 1.6k sao, viết chủ yếu bằng TypeScript. 👾 AI-native Visual Analytics framework build for agents.
Tóm tắt dựng từ metadata GitHub của chính dự án — chưa có bài review TopGit. Trang sẽ tự động cập nhật khi bài review đầy đủ được xuất bản.
VÌ SAO CHƯA CÓ REVIEW
TopGit viết bài đầy đủ cho repo có nhiều sao nhất và được yêu cầu nhiều nhất. Trang này là snapshot trong thời gian chờ — xem README gốc ở tab READ ME.
AVA ( Visual Analytics) is a technology framework designed for more convenient visual analytics. A stands for AI-native, Automated, and Augmented; VA stands for Visual Analytics.
[!NOTE]
Think of AVA as PandasAI for JavaScript. 💬📊🤖
It brings natural-language data analysis and visualization to your apps and AI agents.
✨ Why AVA?
🔌 Unified data access
Connect files and databases through one interface.
Data sources →
🔎 Grounded answers
Inspect the queries and results behind each answer.
Trusted analysis →
📊 Smart visualization
Get charts guided by your question and data.
Visualization →
💻 Local execution
Choose where analysis runs and which model endpoint it uses.
Execution engines →
🎯 Published benchmarks
Check accuracy against reference answers under published test conditions.
Benchmarks →
🤖 Agent integration
Your agent reasons; AVA executes the data workflow.
Agent integration →
🚀 Getting started
Install AVA 4.0 with Node.js 22.13+:
npm install @antv/ava@4
💻 Usage
Download sales.csv and configure your model:
import { AVA } from '@antv/ava';

const ava = new AVA({
  llm: {
    model: '<your-model>',
    apiKey: '<your-api-key>',
    // baseURL: '<your-provider-api-url>',
  },
});
Inspect the structure and data quality, then add business definitions:
const schema = await ava.schema();
const profile = await ava.profile({ metrics: ['row_count', 'null_count'] });
await ava.semantic(undefined, () => ({
  description: 'Use the sales column for amounts after discounts and order_date for monthly comparisons.',
}));
[!NOTE]
Analysis context
Context
Details
Structure
data: 12 columns
Quality
240 rows; 1 missing region and 1 missing quantity
Semantics
sales is after discounts; monthly comparisons use order_date
3. Suggest
const suggestions = await ava.suggest(3);
[!NOTE]
Suggested questions (examples)
How did sales change from January to February 2025?
Which products contributed most to the sales decline?
How do sales and profit vary by region?
4. Analyze
const result = await ava.analyze(
  'Compare January and February 2025 sales by product. Show both months and the change, ordered by the largest decline.'
);
[!NOTE]
Analysis result
Total sales fell 43.94%, led by a 16,092.10 decline in laptop sales.
First 3 of 9 products:
Product
January sales
February sales
Change
Laptop
19,688.10
3,596.00
−16,092.10
Standing Desk
9,655.80
5,546.10
−4,109.70
Monitor
6,536.25
4,731.00
−1,805.25
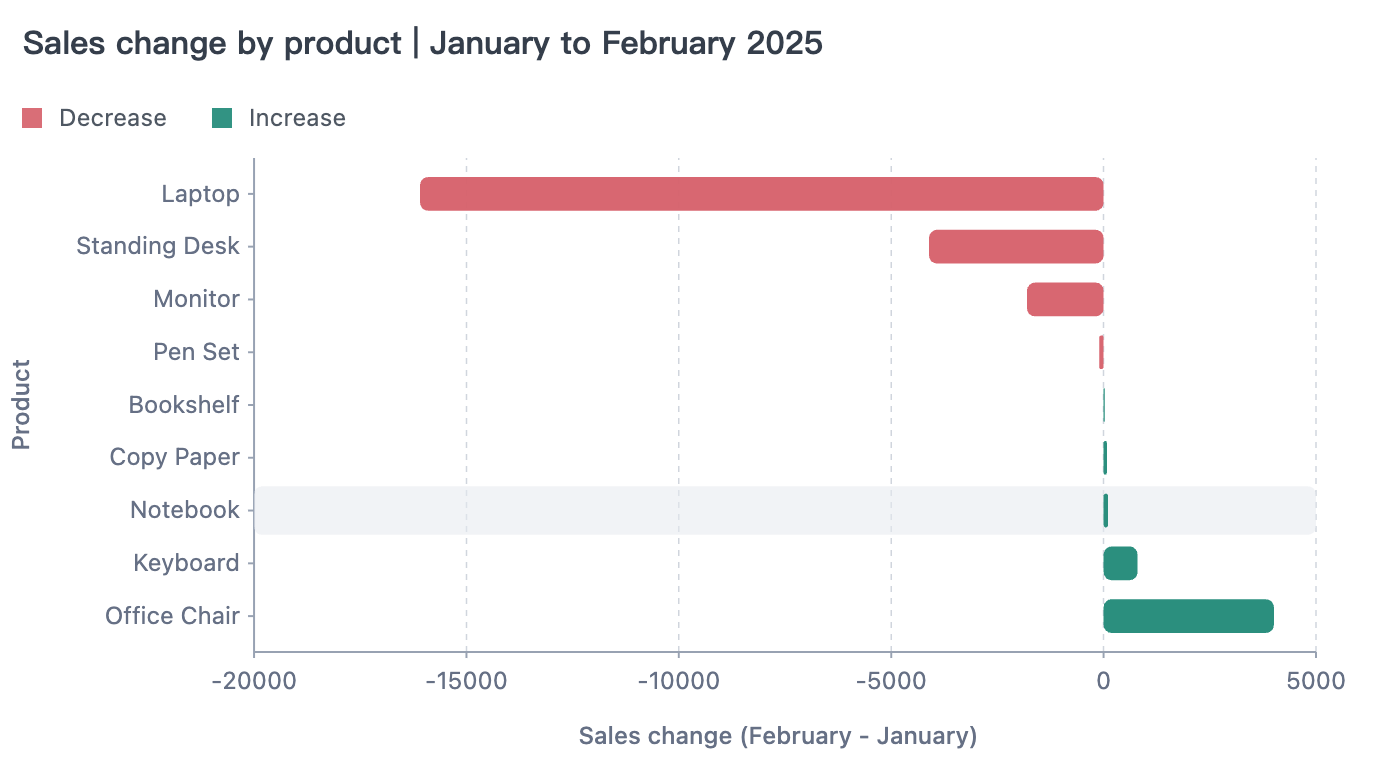
5. Visualize
const chart = await ava.visualize({
  query: 'Plot the sales change by product from January to February 2025 as a bar chart.',
  data: result.data,
});
[!NOTE]
Chart preview
Powered by GPT-Vis.
🔌 Connect your data
CSV
JSON
Parquet
Excel
Text
Feishu Bitable
Tencent Docs
SQLite
MySQL
PostgreSQL
SQL Server
MongoDB
Supabase
ClickHouse
[!TIP]
Missing a data source? 💡🛠️
💬 Open an issue · 🛠️ Submit a pull request
🎯 Benchmarks
We evaluate AVA on established benchmarks to measure the accuracy and efficiency of its data analysis.
Evaluation setup and reports →
🧩 More ways to use AVA
The agent and CLI workflows run on Node.js 22.13+ on macOS or Linux.
Use with an Agent
Ask your AI agent:
Install the AVA skill with `npx skills add antvis/AVA`, then follow its setup instructions.
Agent setup guide →
Use from the CLI
Load and analyze data from your terminal:
ava source ./sales.csv
ava analyze '<dataset-id>' 'Compare January and February 2025 sales by product.'
See the CLI guide for setup and commands.
📚 Resources
Documentation — Guides and examples
Analysis strategies — Direct and loop execution
API Reference — Methods and configuration
AI — Try out AVA in the browser environment
Benchmarks — Evaluation results
Issues — Bug reports and feature requests
🤝🛠️ Contributing
Contributions are welcome. Include tests, examples, and documentation with new features.
Run npm test to test your changes. For model-backed tests, copy .env.example to .env and add your model settings.
📑 Papers
VizLinter - Chen, Q., Sun, F., Xu, X., Chen, Z., Wang, J. and Cao, N., 2021. VizLinter: A Linter and Fixer Framework for Data Visualization. IEEE transactions on visualization and computer graphics, 28(1), pp.206-216.
《数据可视化设计的类型学实践》(Exploring the Typology of Visualization Design) - 蓝星宇, 王嘉喆. 数据可视化设计的类型学实践, 《美术大观》, 2022(3), 149-152.
antvis/AVA có 1.6k sao GitHub — tải lại trang để xem số mới nhất, hoặc xem trực tiếp github.com/antvis/AVA. TopGit phản chiếu số sao của GitHub nhưng không cam kết đến từng phút.
Commit gần nhất trên antvis/AVA là 12 ngày trước (theo timestamp GitHub). Repo có 168 fork — một chỉ báo về mức độ quan tâm của cộng đồng.
antvis/AVA là gì?
antvis/AVA (antvis/AVA) là dự án TypeScript trên GitHub. Theo mô tả gốc: 👾 AI-native Visual Analytics framework build for agents.
antvis/AVA so với các dự án Data khác thế nào?
antvis/AVA được TopGit xếp vào nhóm Data, với 1.6k sao GitHub và viết bằng TypeScript. Xem trang chủ đề Data trên TopGit để so sánh với các dự án tương tự theo số sao và mức độ hoạt động.
antvis/AVA viết bằng ngôn ngữ gì?
antvis/AVA chủ yếu viết bằng TypeScript. Trường "language" của GitHub dựa trên phần lớn byte ở nhánh mặc định.
Vì sao antvis/AVA được xếp vào nhóm Data?
TopGit xếp antvis/AVA vào nhóm Data dựa trên GitHub topics và mô tả của repo (gắn thẻ: "agent-skills", "ai-agents", "augmented-analytics"). Việc phân loại dựa trên metadata thật của repo, không phải đoán theo cảm tính biên tập.
Đọc đầy đủ README ở tab phía trên.
AVA có đáng để bạn bỏ thời gian?
ChatGPT, Claude và Perplexity đều đọc được trang này. Hỏi thử xem họ nghĩ gì về AVA.

 /AVA


 Visual Analytics) is a technology framework designed for more convenient visual analytics. A stands for AI-native, Automated, and Augmented; VA stands for Visual Analytics.