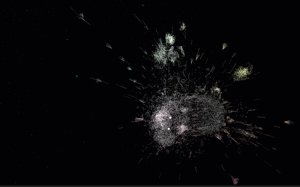
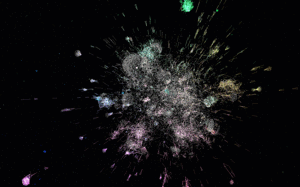
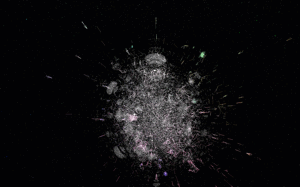
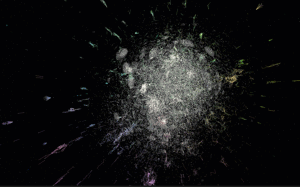
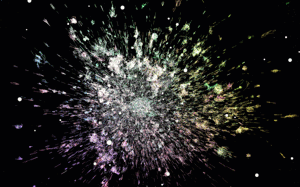
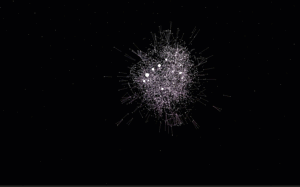
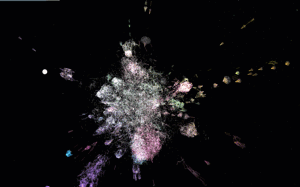
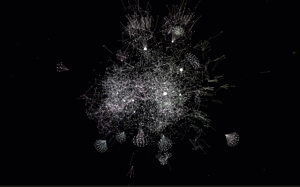
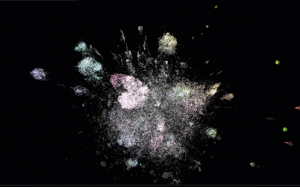
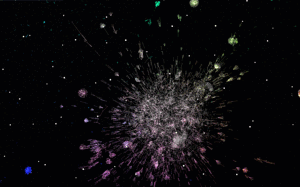
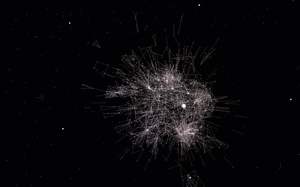
Một mục mã nguồn mở trong kho dữ liệu GitHub của TopGit: anvaka/pm, 1.8k sao, JavaScript. package managers visualization
Tóm tắt dựng từ metadata GitHub của chính dự án — chưa có bài review TopGit. Trang sẽ tự động cập nhật khi bài review đầy đủ được xuất bản.
VÌ SAO CHƯA CÓ REVIEW
TopGit viết bài đầy đủ cho repo có nhiều sao nhất và được yêu cầu nhiều nhất. Trang này là snapshot trong thời gian chờ — xem README gốc ở tab READ ME.
This repository combines visualizations of major software package managers.
All visualizations are available here: http://anvaka.github.io/pm/#/
Please read operating manual -
it is short and describes basic navigation principles.
Repository was create for my talk at CascadiaJS 2015
After conference update - video -
slides
Friends, you are awesome! I can't express how much I appreciate all your
kind words and warm feedback. It really means a world for me. Thank you!
Individual Visualizations
Each graph is indexed individually, and data is pushed to gh-pages branch
of galactic-data.
Bower
indexer |
demo
PHP Composer
indexer |
demo
Ruby gems
indexer |
demo
npm
indexer |
demo
Go
indexer |
demo
R language
indexer |
demo
Debian
indexer |
demo
Arch Linux
indexer |
demo
Arch Linux + AUR
indexer |
demo
NuGet
indexer |
demo
Homebrew
indexer |
demo
PyPI
indexer |
demo
Fedora
indexer |
demo
Rust Crates
indexer |
demo
Elm
indexer |
demo
local development
git clone https://github.com/anvaka/pm
cd pm
npm i
npm start
This will start local development sever with auto-rebuild.
Your own graphs
This section has detailed instructions about how to use the tool
with your own graphs. Before you read any further, if your graph
is smaller than 10k nodes, consider using ngraph.pixel
or VivaGraph both should
be able to provide interactive layout.
If you have an interesting graph but don't have JavaScript experience,
please feel free to reach out to me and I'll try to make visualization
for you (my email is [email protected]).
Otherwise, if you want to hack on your own, please keep reading.
Graph
First, you will need a graph in ngraph.graph
format. The ngraph.graph has detailed documentation about how to create graph,
but it also has several loaders from popular graph formats (e.g. dot,
gexf)
Layout
Now that you have a graph we need to compute the layout.
If your graph is smaller than 200k nodes, consider using ngraph.offline.layout. This module was
created exactly for the purpose of the pm project, it is well documented, and
should be easy to get started with. You can also read layout.js of all[gems|go|bower]
packages to see more examples.
If your graph is much larger than 200k nodes, then consider using
ngraph.native - this module
is harder to work with (as it requires C++ knowledge), but it is much
faster.
The secret GitHub visualization is using ngraph.native.
Data format
Once layout is computed, we are ready to visualize. Just save the graph using
ngraph.tobinary
and store it along with latest positions file (produced by layout) into a folder.
The folder structure should look like this:
.
└── my-pm-data-server
    └── my-graph
        ├── manifest.json
        └── version-1
            ├── labels.json         /* this file is produced by ngraph.tobinary */
            ├── links.bin           /* this file is produced by ngraph.tobinary */
            └── positions.bin       /* this file is produced by ngraph.native   */
The file manifest.json describes what version of the graph are available and has the following
content:
{
  "all": ["version-1"],
  "last": "version-1"
}
Inside my-pm-data-server we launch a web server. I personally prefer http-server. Once it is installed globally (npm i http-server -g), you can launch it like this:
http-server --cors -p 9090
This will start a local data server at http://127.0.0.1:9090/
Update the config.js in
this repository to point to your data server, and your graph should be accessible at
http://127.0.0.1:8081/#/galaxy/my-graph
Note
The galactic-data follows the same
data structure as described above. Use it for the reference if you need an example
The secret visualization
The last shown visualization was secret GitHub followers visualization.
It shows all GitHub users who has more than two followers.
The visualization has more than 1,100,000 nodes, and renders
at 60 fps when flying around. The FPS drops when you hover-over
nodes to 20-30, This is because we are doing hit-testing,
to find what's under cursor.
With this many nodes, it runs well in the browser. Unfortunately
it requires more than 1GB of RAM. Which may or may not crash
your phone browser - sorry about this.
With all warnings said, here are the links:
Indexed by allgithub
Live demo
Feedback
Please do not hesitate to provide your feedback or bug fixes.
Even if it is something small like fixing a typo - I'd be glad to
hear from you!
anvaka/pm có 1.8k sao GitHub — tải lại trang để xem số mới nhất, hoặc xem trực tiếp github.com/anvaka/pm. TopGit phản chiếu số sao của GitHub nhưng không cam kết đến từng phút.
anvaka/pm có phải mã nguồn mở không?
Có — anvaka/pm phát hành theo license MIT, nghĩa là mã nguồn mở để đọc, fork và (tùy license) tái sử dụng. Mã: github.com/anvaka/pm.
anvaka/pm còn đang phát triển không?
Commit gần nhất trên anvaka/pm là 4 tháng trước (theo timestamp GitHub). Repo có 159 fork — một chỉ báo về mức độ quan tâm của cộng đồng.
anvaka/pm là gì?
anvaka/pm (anvaka/pm) là dự án JavaScript trên GitHub. Theo mô tả gốc: package managers visualization
Đọc thêm về anvaka/pm ở đâu?
Trang TopGit này là một snapshot — tab "Readme" hiển thị nguyên văn README của repo (đã bỏ link, giữ ảnh). Repo GitHub ở github.com/anvaka/pm là nguồn chính thức.
Đọc đầy đủ README ở tab phía trên.
pm có đáng để bạn bỏ thời gian?
ChatGPT, Claude và Perplexity đều đọc được trang này. Hỏi thử xem họ nghĩ gì về pm.

 /pm