
jwilber/roughViz


Trên GitHub, jwilber/roughViz đã đạt 7.2k sao, nhóm Data, ngôn ngữ JavaScript. Reusable JavaScript library for creating sketchy/hand-drawn styled charts in the browser.
Tóm tắt dựng từ metadata GitHub của chính dự án — chưa có bài review TopGit. Trang sẽ tự động cập nhật khi bài review đầy đủ được xuất bản.
TopGit viết bài đầy đủ cho repo có nhiều sao nhất và được yêu cầu nhiều nhất. Trang này là snapshot trong thời gian chờ — xem README gốc ở tab READ ME.
Snapshot
Cộng tác viên hàng đầu
Xem cộng tác viên hàng đầu
roughViz.js is a reusable JavaScript library for creating sketchy/hand-drawn styled charts in the browser, based on D3v5, roughjs, and handy.
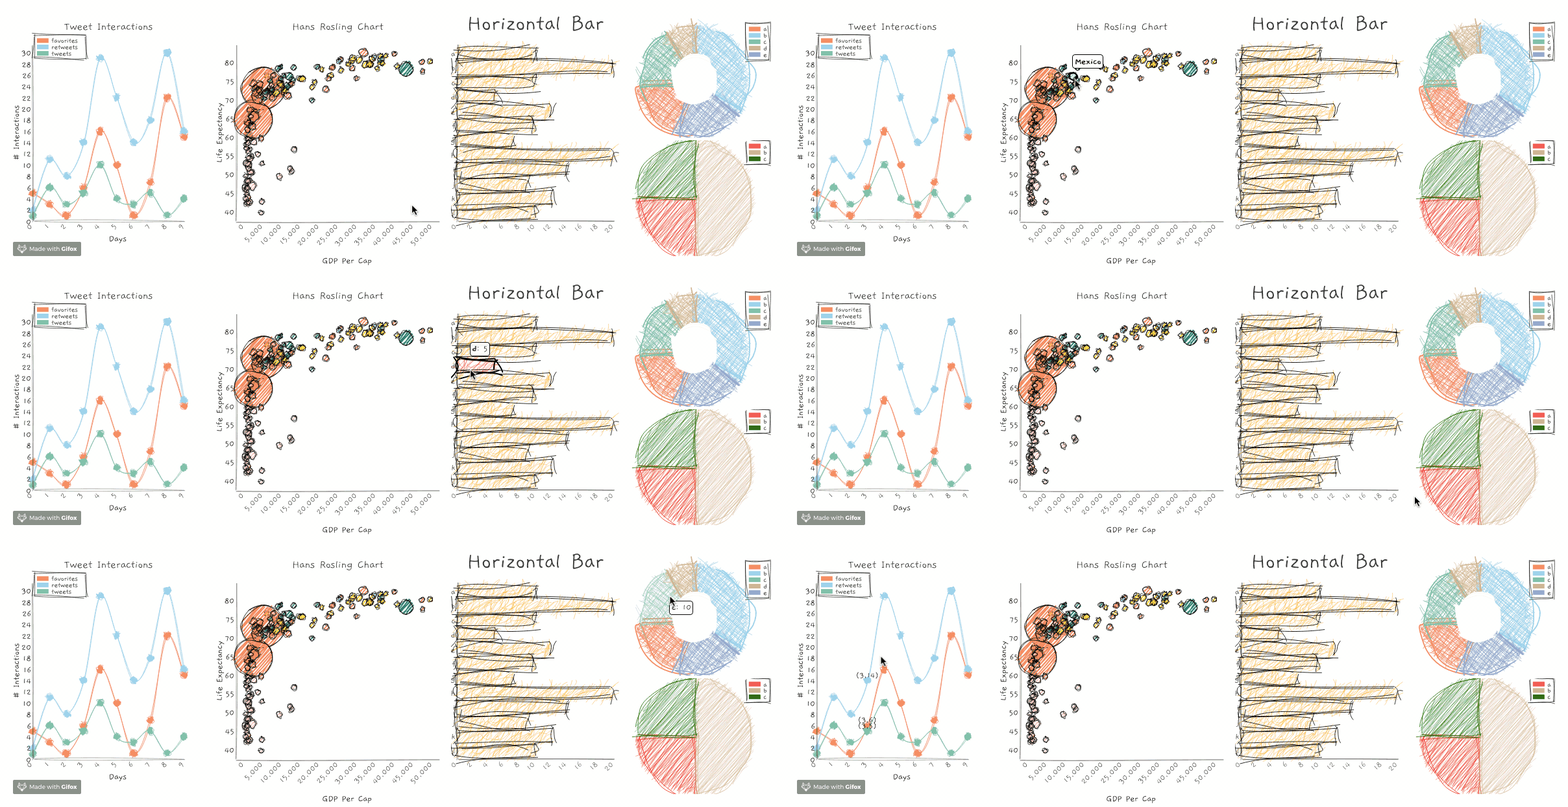
Why?
Use these charts where the communication goal is to show intent or generality, and not absolute precision. Or just because they're fun and look weird.
Chart Types
| Chart Type | API |
|---|---|
| Bar | roughViz.Bar |
| Horizontal Bar | roughViz.BarH |
| Donut | roughViz.Donut |
| Line | roughViz.Line |
| Pie | roughViz.Pie |
| Scatter | roughViz.Scatter |
| Stacked Bar | roughViz.StackedBar |
Visit this link for interactive examples of each chart.
Features
Apply the features of roughjs to each chart:
roughness:

fillStyle

fillWeight

As well as additional chart-specific options (see API below)
Installation
Via CDN (expose the roughViz global in html):
<script src="https://unpkg.com/[email protected]"></script>
Via npm:
npm install rough-viz
Want to use with React? There's a wrapper!:
npm install react-roughviz
Want to use with Vue? There's a wrapper!:
npm install vue-roughviz
Want to use it with Python? Go crazy:
pip install py-roughviz
How to use
If you're using ESM, make sure to import the library:
import roughViz from "rough-viz";
Create some container elements, one for each chart:
<!--you can name each id whatever you want -->
<div id="viz0"></div>
<div id="viz1"></div>
In the javascript, just create charts, referencing the desired container:
// create Bar chart from csv file, using default options
 new roughViz.Bar({
    element: '#viz0', // container selection
    data: 'https://raw.githubusercontent.com/jwilber/random_data/master/flavors.csv',
    labels: 'flavor',
    values: 'price'
});

// create Donut chart using defined data & customize plot options
new roughViz.Donut(
  {
    element: '#viz1',
    data: {
      labels: ['North', 'South', 'East', 'West'],
      values: [10, 5, 8, 3]
    },
    title: "Regions",
    width: window.innerWidth / 4,
    roughness: 8,
    colors: ['red', 'orange', 'blue', 'skyblue'],
    stroke: 'black',
    strokeWidth: 3,
    fillStyle: 'cross-hatch',
    fillWeight: 3.5,
  }
);
API
roughViz.Bar
Required
-
element[string]: Id or class of container element. -
data: Data with which to construct chart. Can be either an object or string.- If object: must contain
labelsandvalueskeys:
new roughViz.Bar({ element: '.viz', data: {labels: ['a', 'b'], values: [10, 20]} })- If string: must be a path/url to a
csvortsv, and you must also specify thelabelsandvaluesas separate attributes that represent columns in said file:
new roughViz.Bar({ element: '#viz0', data: 'stringToDataUrl.csv', labels: 'nameOfLabelsColumn', values: 'nameOfValuesColumn', }) - If object: must contain
Optional
axisFontSize[string]: Font-size for axes' labels. Default:'1rem'.axisRoughness[number]: Roughness for x & y axes. Default:0.5.axisStrokeWidth[number]: Stroke-width for x & y axes. Default:0.5.bowing[number]: Chart bowing. Default:0.color[string]: Color for each bar. Default:'skyblue'.fillStyle[string]: Bar fill-style. Should be one of fillStyles shown above.fillWeight[number]: Weight of inner paths' color. Default:0.5.font: Font-family to use. You can use0orgaeguto useGaegu, or1orindie flowerto useIndie Flower. Or feed it something else. Default:Gaegu.highlight[string]: Color for each bar on hover. Default:'coral'.innerStrokeWidth[number]: Stroke-width for paths inside bars. Default:1.interactive[boolean]: Whether or not chart is interactive. Default:true.labelFontSize[string]: Font-size for axes' labels. Default:'1rem'.margin[object]: Margin object. Default:{top: 50, right: 20, bottom: 70, left: 100}padding[number]: Padding between bars. Default:0.1.roughness[number]: Roughness level of chart. Default:1.simplification[number]: Chart simplification. Default0.2.stroke[string]: Color of bars' stroke. Default:black.strokeWidth[number]: Size of bars' stroke. Default:1.title[string]: Chart title. Optional.titleFontSize[string]: Font-size for chart title. Default:'1rem'.tooltipFontSize[string]: Font-size for tooltip. Default:'0.95rem'.xLabel[string]: Label for x-axis.yLabel[string]: Label for y-axis.
roughViz.BarH
Required
-
element[string]: Id or class of container element. -
data: Data with which to construct chart. Can be either an object or string.- If object: must contain
labelsandvalueskeys:
new roughViz.BarH({ element: '.viz', data: {labels: ['a', 'b'], values: [10, 20]} })- If string: must be a path/url to a
csvortsv, and you must also specify thelabelsandvaluesas separate attributes that represent columns in said file:
new roughViz.BarH({ element: '#viz0', data: 'stringToDataUrl.csv', labels: 'nameOfLabelsColumn', values: 'nameOfValuesColumn', }) - If object: must contain
Optional
axisFontSize[string]: Font-size for axes' labels. Default:'1rem'.axisRoughness[number]: Roughness for x & y axes. Default:0.5.axisStrokeWidth[number]: Stroke-width for x & y axes. Default:0.5.bowing[number]: Chart bowing. Default:0.color[string]: Color for each bar. Default:'skyblue'.fillStyle[string]: Bar fill-style. Should be one of fillStyles shown above.fillWeight[number]: Weight of inner paths' color. Default:0.5.font: Font-family to use. You can use0orgaeguto useGaegu, or1orindie flowerto useIndie Flower. Or feed it something else. Default:Gaegu.highlight[string]: Color for each bar on hover. Default:'coral'.innerStrokeWidth[number]: Stroke-width for paths inside bars. Default:1.interactive[boolean]: Whether or not chart is interactive. Default:true.labelFontSize[string]: Font-size for axes' labels. Default:'1rem'.margin[object]: Margin object. Default:{top: 50, right: 20, bottom: 70, left: 100}padding[number]: Padding between bars. Default:0.1.roughness[number]: Roughness level of chart. Default:1.simplification[number]: Chart simplification. Default0.2.stroke[string]: Color of bars' stroke. Default:black.strokeWidth[number]: Size of bars' stroke. Default:1.title[string]: Chart title. Optional.titleFontSize[string]: Font-size for chart title. Default:'1rem'.tooltipFontSize[string]: Font-size for tooltip. Default:'0.95rem'.xLabel[string]: Label for x-axis.yLabel[string]: Label for y-axis.
roughViz.Donut
Required
-
element[string]: Id or class of container element. -
data: Data with which to construct chart. Can be either an object or string.- If object: must contain
labelsandvalueskeys:
new roughViz.Donut({ element: '.viz', data: {labels: ['a', 'b'], values: [10, 20]} })- If string: must be a path/url to a
csv,json, ortsv, and you must also specify thelabelsandvaluesas separate attributes that represent columns in said file:
new roughViz.Donut({ element: '#viz0', data: 'stringToDataUrl.csv', labels: 'nameOfLabelsColumn', values: 'nameOfValuesColumn', }) - If object: must contain
Optional
bowing[number]: Chart bowing. Default:0.colors[array]: Array of colors for each arc. Default:['coral', 'skyblue', '#66c2a5', 'tan', '#8da0cb', '#e78ac3', '#a6d854', '#ffd92f', 'tan', 'orange'].fillStyle[string]: Bar fill-style. Should be one of fillStyles shown above.fillWeight[number]: Weight of inner paths' color. Default:0.85.font: Font-family to use. You can use0orgaeguto useGaegu, or1orindie flowerto useIndie Flower. Or feed it something else. Default:Gaegu.highlight[string]: Color for each arc on hover. Default:'coral'.innerStrokeWidth[number]: Stroke-width for paths inside arcs. Default:0.75.interactive[boolean]: Whether or not chart is interactive. Default:true.legend[boolean]: Whether or not to add legend. Default:'true'.legendPosition[string]: Position of legend. Should be either'left'or'right'. Default:'right'.margin[object]: Margin object. Default:{top: 50, right: 20, bottom: 70, left: 100}padding[number]: Padding between bars. Default:0.1.roughness[number]: Roughness level of chart. Default:1.simplification[number]: Chart simplification. Default0.2.strokeWidth[number]: Size of bars' stroke. Default:1.title[string]: Chart title. Optional.titleFontSize[string]: Font-size for chart title. Default:'1rem'.tooltipFontSize[string]: Font-size for tooltip. Default:'0.95rem'.
roughViz.Line
Required
element[string]: Id or class of container element.data: Must be a path/url to acsvortsv, and you must also specify the eachyas separate attributes that represent columns in said file. Each attribute prefaced withy(exceptyLabel) will receive its own line:new roughViz.Line({ element: '#viz0', data: 'https://raw.githubusercontent.com/jwilber/random_data/master/profits.csv', y1: 'revenue', y2: 'cost', y3: 'profit' })
Optional
axisFontSize[string]: Font-size for axes' labels. Default:'1rem'.axisRoughness[number]: Roughness for x & y axes. Default:0.5.axisStrokeWidth[number]: Stroke-width for x & y axes. Default:0.5.bowing[number]: Chart bowing. Default:0.circle[boolean]: Whether or not to add circles to chart. Default:true.circleRadius[number]: Radius of circles. Default:10.circleRoughness[number]: Roughness of circles. Default:2.colors[array or string]: Array of colors for each arc. Default:['coral', 'skyblue', '#66c2a5', 'tan', '#8da0cb', '#e78ac3', '#a6d854', '#ffd92f', 'tan', 'orange']. If string (e.g.'blue'), all circles will take that color.fillStyle[string]: Bar fill-style. Should be one of fillStyles shown above.fillWeight[number]: Weight of inner paths' color. Default:0.5.font: Font-family to use. You can use0orgaeguto useGaegu, or1orindie flowerto useIndie Flower. Or feed it something else. Default:Gaegu.interactive[boolean]: Whether or not chart is interactive. Default:true.labelFontSize[string]: Font-size for axes' labels. Default:'1rem'.legend[boolean]: Whether or not to add legend. Default:true.legendPosition[string]: Position of legend. Should be either'left'or'right'. Default:'right'.margin[object]: Margin object. Default:{top: 50, right: 20, bottom: 70, left: 100}roughness[number]: Roughness level of chart. Default:1.simplification[number]: Chart simplification. Default0.2.stroke[string]: Color of lines' stroke. Default:this.colors.strokeWidth[number]: Size of lines' stroke. Default:1.title[string]: Chart title. Optional.titleFontSize[string]: Font-size for chart title. Default:'0.95rem'.tooltipFontSize[string]: Font-size for tooltip. Default:'0.95rem'.xLabel[string]: Label for x-axis.yLabel[string]: Label for y-axis.
roughViz.Pie
Required
-
element[string]: Id or class of container element. -
data: Data with which to construct chart. Can be either an object or string.- If object: must contain
labelsandvalueskeys:
new roughViz.Pie({ element: '.viz', data: {labels: ['a', 'b'], values: [10, 20]} })- If string: must be a path/url to a
csv,json, ortsv, and you must also specify thelabelsandvaluesas separate attributes that represent columns in said file:
new roughViz.Pie({ element: '#viz0', data: 'stringToDataUrl.csv', labels: 'nameOfLabelsColumn', values: 'nameOfValuesColumn', }) - If object: must contain
Optional
bowing[number]: Chart bowing. Default:0.colors[array]: Array of colors for each arc. Default:['coral', 'skyblue', '#66c2a5', 'tan', '#8da0cb', '#e78ac3', '#a6d854', '#ffd92f', 'tan', 'orange'].fillStyle[string]: Bar fill-style. Should be one of fillStyles shown above.fillWeight[number]: Weight of inner paths' color. Default:0.85.font: Font-family to use. You can use0orgaeguto useGaegu, or1orindie flowerto useIndie Flower. Or feed it something else. Default:Gaegu.highlight[string]: Color for each arc on hover. Default:'coral'.innerStrokeWidth[number]: Stroke-width for paths inside arcs. Default:0.75.interactive[boolean]: Whether or not chart is interactive. Default:true.legend[boolean]: Whether or not to add legend. Default:true.legendPosition[string]: Position of legend. Should be either'left'or'right'. Default:'right'.margin[object]: Margin object. Default:{top: 50, right: 20, bottom: 70, left: 100}padding[number]: Padding between bars. Default:0.1.roughness[number]: Roughness level of chart. Default:1.simplification[number]: Chart simplification. Default0.2.strokeWidth[number]: Size of bars' stroke. Default:1.title[string]: Chart title. Optional.titleFontSize[string]: Font-size for chart title. Default:'1rem'.tooltipFontSize[string]: Font-size for tooltip. Default:'0.95rem'.
roughViz.Scatter
Required
-
element[string]: Id or class of container element. -
data: Data with which to construct chart. Can be either an object or string.- If object: must contain
xandykeys:
new roughViz.Scatter({ element: '.viz', data: {x: [1, 2, 35], y: [10, 20, 8]} })- If string: must be a path/url to a
csvortsv, and you must also specify thexandyas separate attributes that represent columns in said file:
new roughViz.Scatter({ element: '#viz0', data: 'stringToDataUrl.csv', x: 'nameOfLabelsColumn', y: 'nameOfValuesColumn', }) - If object: must contain
Optional
axisFontSize[string]: Font-size for axes' labels. Default:'1rem'.axisRoughness[number]: Roughness for x & y axes. Default:0.5.axisStrokeWidth[number]: Stroke-width for x & y axes. Default:0.5.bowing[number]: Chart bowing. Default:0.colors[array or string]: Array of colors for each arc. Default:['coral', 'skyblue', '#66c2a5', 'tan', '#8da0cb', '#e78ac3', '#a6d854', '#ffd92f', 'tan', 'orange']. If string (e.g.'blue'), all circles will take that color.colorVar[string]: If input data iscsvortsv, this should be an ordinal column with which to color points by.curbZero[boolean]: Whether or not to force (x, y) axes to (0, 0). Default:false.fillStyle[string]: Bar fill-style. Should be one of fillStyles shown above.fillWeight[number]: Weight of inner paths' color. Default:0.5.font: Font-family to use. You can use0orgaeguto useGaegu, or1orindie flowerto useIndie Flower. Or feed it something else. Default:Gaegu.highlight[string]: Color for each bar on hover. Default:'coral'.highlightLabel[string]: If input data iscsvortsv, this should be a column representing what value to display on hover. Otherwise,(x, y)values will be shown on hover.innerStrokeWidth[number]: Stroke-width for paths inside circles. Default:1.interactive[boolean]: Whether or not chart is interactive. Default:true.labelFontSize[string]: Font-size for axes' labels. Default:'1rem'.margin[object]: Margin object. Default:{top: 50, right: 20, bottom: 70, left: 100}radius[number]: Circle radius. Default:8.roughness[number]: Roughness level of chart. Default:1.simplification[number]: Chart simplification. Default0.2.stroke[string]: Color of circles' stroke. Default:black.strokeWidth[number]: Size of circles' stroke. Default:1.title[string]: Chart title. Optional.titleFontSize[string]: Font-size for chart title. Default:'0.95rem'.tooltipFontSize[string]: Font-size for tooltip. Default:'0.95rem'.xLabel[string]: Label for x-axis.yLabel[string]: Label for y-axis.
roughViz.StackedBar
Required
-
element[string]: Id or class of container element. -
data: Data with which to construct chart. Should be an object. -
labels: String name of label key indataobject.new roughViz.StackedBar({ element: '#vis0', data: [ {month:'Jan', A:20, B: 5}, {month:'Feb', A:25, B: 10}, ], labels: 'month', })
Optional
axisFontSize[string]: Font-size for axes' labels. Default:'1rem'.axisRoughness[number]: Roughness for x & y axes. Default:0.5.axisStrokeWidth[number]: Stroke-width for x & y axes. Default:0.5.bowing[number]: Chart bowing. Default:0.colors[string]: Array of colors for each bar grouping.fillStyle[string]: Bar fill-style. Should be one of fillStyles shown above.fillWeight[number]: Weight of inner paths' color. Default:0.5.font: Font-family to use. You can use0orgaeguto useGaegu, or1orindie flowerto useIndie Flower. Or feed it something else. Default:Gaegu.highlight[string]: Color for each bar on hover. Default:'coral'.innerStrokeWidth[number]: Stroke-width for paths inside bars. Default:1.interactive[boolean]: Whether or not chart is interactive. Default:true.labelFontSize[string]: Font-size for axes' labels. Default:'1rem'.margin[object]: Margin object. Default:{top: 50, right: 20, bottom: 70, left: 100}padding[number]: Padding between bars. Default:0.1.roughness[number]: Roughness level of chart. Default:1.simplification[number]: Chart simplification. Default0.2.stroke[string]: Color of bars' stroke. Default:black.strokeWidth[number]: Size of bars' stroke. Default:1.title[string]: Chart title. Optional.titleFontSize[string]: Font-size for chart title. Default:'1rem'.tooltipFontSize[string]: Font-size for tooltip. Default:'0.95rem'.xLabel[string]: Label for x-axis.yLabel[string]: Label for y-axis.
Contributors
- Jared Wilber
- Laimonas Andriejauskas
- Dave Slutzkin
- JoLo
- Lucas Wilber
Acknowledgements
This library wouldn't be possible without the following people:
- Mike Bostock for D3.js.
- Preet Shihn for rough.js.
- Jo Wood for handy processing lib.
License
MIT License
Copyright (c) 2019 Jared Wilber
Permission is hereby granted, free of charge, to any person obtaining a copy of this software and associated documentation files (the "Software"), to deal in the Software without restriction, including without limitation the rights to use, copy, modify, merge, publish, distribute, sublicense, and/or sell copies of the Software, and to permit persons to whom the Software is furnished to do so, subject to the following conditions:
The above copyright notice and this permission notice shall be included in all copies or substantial portions of the Software.
THE SOFTWARE IS PROVIDED "AS IS", WITHOUT WARRANTY OF ANY KIND, EXPRESS OR IMPLIED, INCLUDING BUT NOT LIMITED TO THE WARRANTIES OF MERCHANTABILITY, FITNESS FOR A PARTICULAR PURPOSE AND NONINFRINGEMENT. IN NO EVENT SHALL THE AUTHORS OR COPYRIGHT HOLDERS BE LIABLE FOR ANY CLAIM, DAMAGES OR OTHER LIABILITY, WHETHER IN AN ACTION OF CONTRACT, TORT OR OTHERWISE, ARISING FROM, OUT OF OR IN CONNECTION WITH THE SOFTWARE OR THE USE OR OTHER DEALINGS IN THE SOFTWARE.
Repo liên quan
Hacker News users split on Grafana: one credits it with easy dashboards, others describe painful InfluxDB-era upgrades. Evidence is from 2021.
Apache Superset is a self-hosted, open source platform for exploring data and building dashboards, pairing a no-code chart builder with a full SQL Editor and a semantic layer for reusable metrics.
10 Weeks, 20 Lessons, Data Science for All!
This is a traditional awesome-list that curates hundreds of Data Science learning resources — from Python/R fundamentals through to deep learning, agents, and MLOps — organized into sections like tutorials, MOOCs, free courses, and a beginner roadmap. It covers the major bases (Pandas, NumPy, Scikit-Learn, data visualization) and goes broader into research tools, LLM/agent frameworks, and interview prep. The tradeoff: it's a link aggregator, not a course — there's no structure to follow beyond what you piece together yourself, and quality of linked resources varies. For someone who already knows what they're looking for, it's a decent bookmark collection; for a complete beginner following a curated path, the sheer volume can be overwhelming without a clear sequence.
Trả lời nhanh
Cùng nhóm Data còn repo nào?
jwilber/roughViz thuộc nhóm Data trên TopGit, cùng 6 topic GitHub. Trang Trending và Topics liệt kê các repo cùng số sao và cùng ngôn ngữ để so sánh.
Đọc thêm về jwilber/roughViz ở đâu?
Trang TopGit này là một snapshot — tab "Readme" hiển thị nguyên văn README của repo (đã bỏ link, giữ ảnh). Repo GitHub ở github.com/jwilber/roughViz là nguồn chính thức.
jwilber/roughViz có phải mã nguồn mở không?
Có — jwilber/roughViz phát hành theo license MIT, nghĩa là mã nguồn mở để đọc, fork và (tùy license) tái sử dụng. Mã: github.com/jwilber/roughViz.
jwilber/roughViz là gì?
jwilber/roughViz (jwilber/roughViz) là dự án JavaScript trên GitHub. Theo mô tả gốc: Reusable JavaScript library for creating sketchy/hand-drawn styled charts in the browser.
jwilber/roughViz so với các dự án Data khác thế nào?
jwilber/roughViz được TopGit xếp vào nhóm Data, với 7.2k sao GitHub và viết bằng JavaScript. Xem trang chủ đề Data trên TopGit để so sánh với các dự án tương tự theo số sao và mức độ hoạt động.
Vì sao jwilber/roughViz được xếp vào nhóm Data?
TopGit xếp jwilber/roughViz vào nhóm Data dựa trên GitHub topics và mô tả của repo (gắn thẻ: "charting-library", "d3v5", "dashboard"). Việc phân loại dựa trên metadata thật của repo, không phải đoán theo cảm tính biên tập.
Đọc đầy đủ README ở tab phía trên.
Chưa chắc roughViz có hợp với bạn?
Để ChatGPT, Claude hoặc Perplexity tìm hiểu giúp — bấm bên dưới và xem AI nói gì về roughViz.