leeoniya/uPlot là dự án Data trên GitHub, viết chủ yếu bằng JavaScript, với 10.4k sao. 📈 A small, fast chart for time series, lines, areas, ohlc & bars
Tóm tắt dựng từ metadata GitHub của chính dự án — chưa có bài review TopGit. Trang sẽ tự động cập nhật khi bài review đầy đủ được xuất bản.
VÌ SAO CHƯA CÓ REVIEW
TopGit viết bài đầy đủ cho repo có nhiều sao nhất và được yêu cầu nhiều nhất. Trang này là snapshot trong thời gian chờ — xem README gốc ở tab READ ME.
A small (~50 KB min), fast chart for time series, lines, areas, ohlc & bars (MIT Licensed)
Introduction
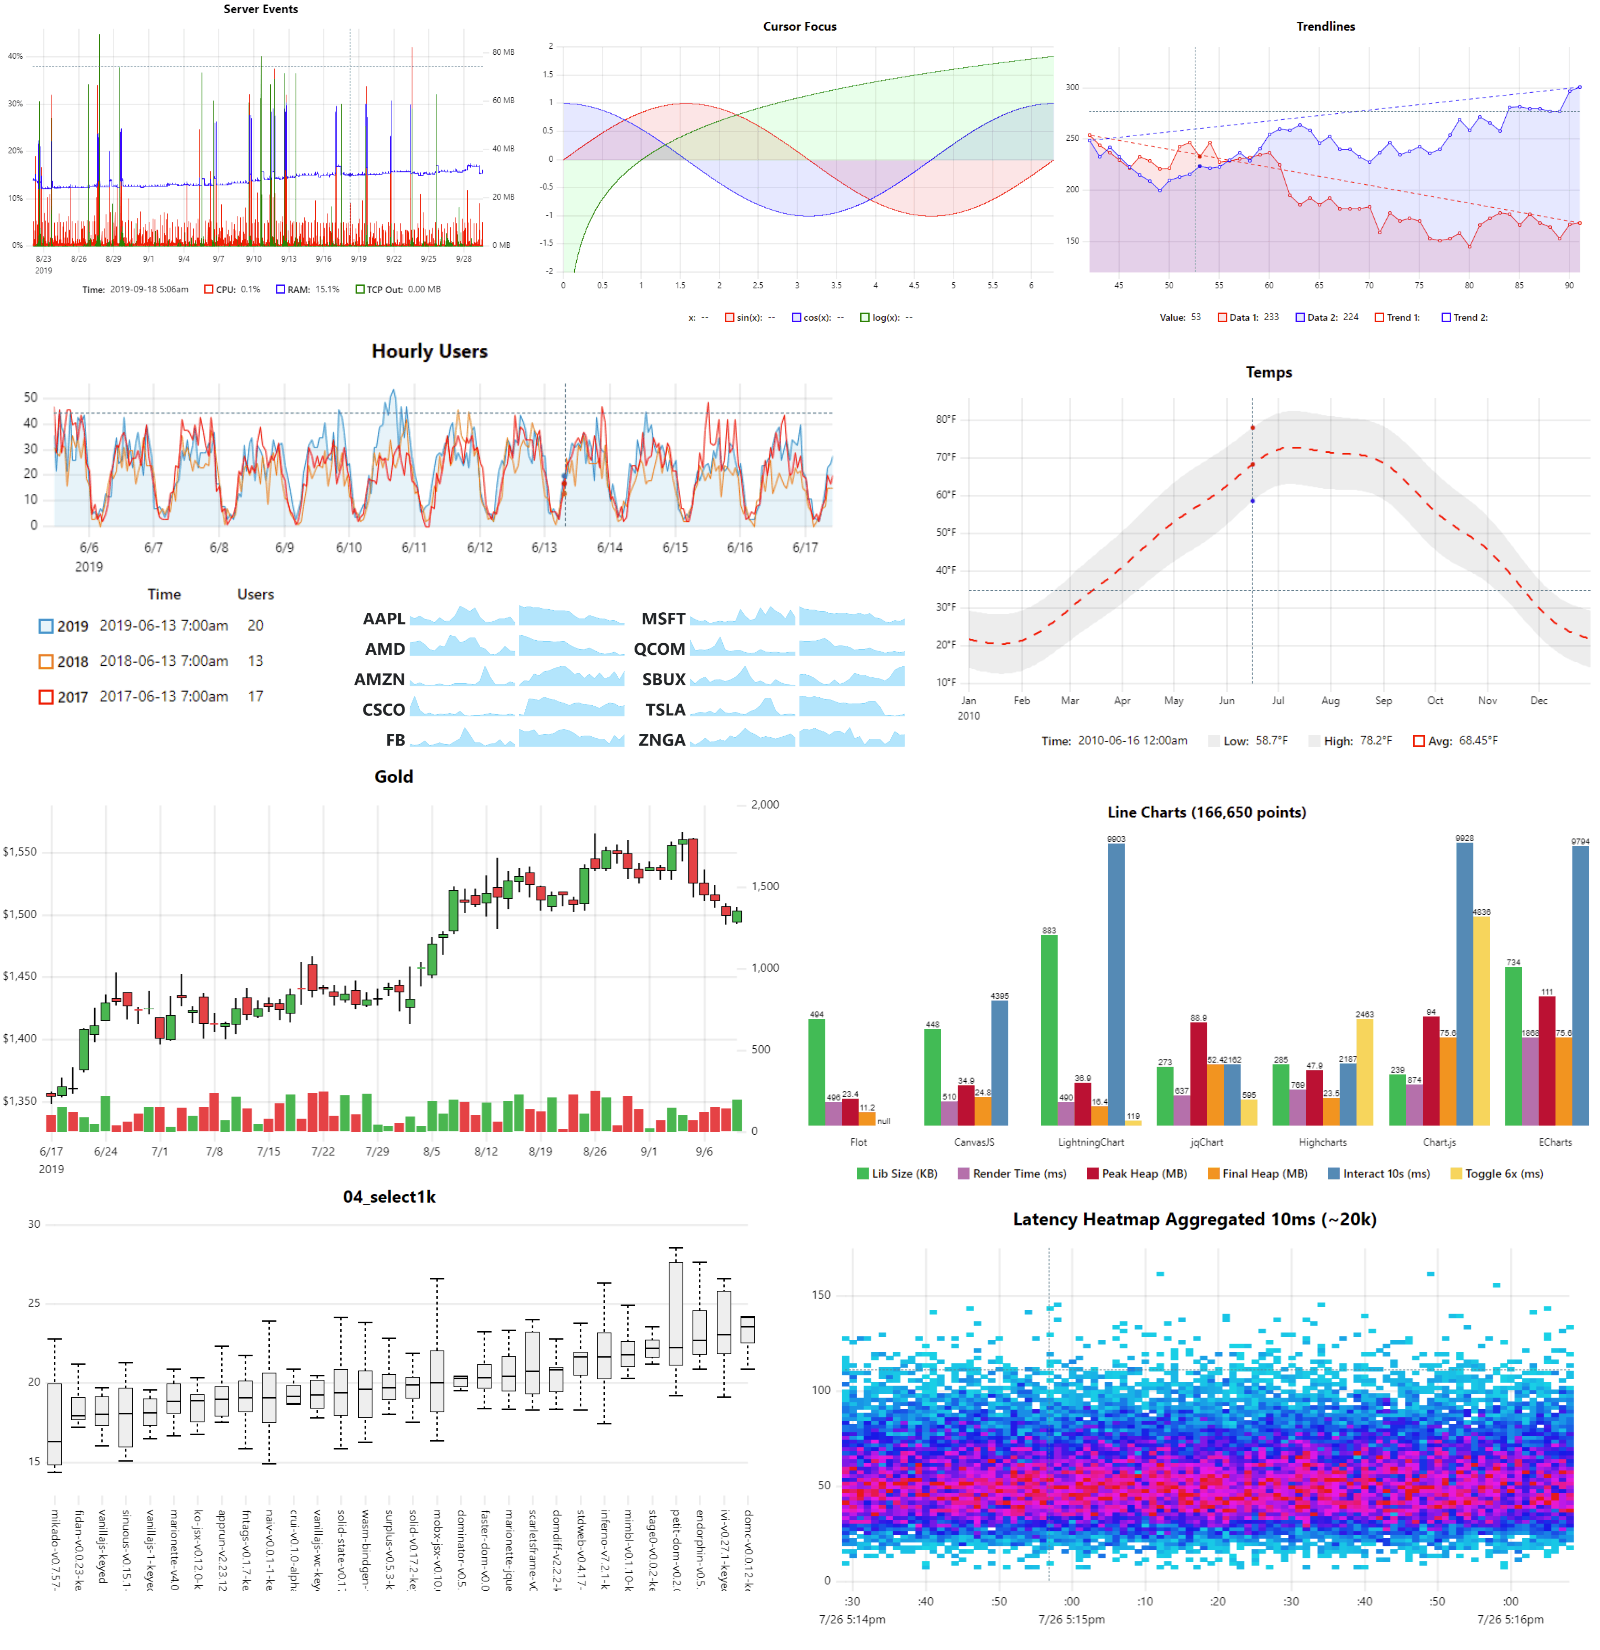
uPlot is a fast, memory-efficient Canvas 2D-based chart for plotting time series, lines, areas, ohlc & bars. From a cold start it can create an interactive chart containing 166,650 data points in 25ms, scaling linearly at ~100,000 pts/ms afterwards. In addition to fast initial render, the zooming and cursor performance is by far the best of any similar charting lib; at ~50 KB, it's likely the smallest and fastest time series plotter that doesn't make use of context-limited WebGL shaders or WASM, both of which have much higher startup cost and code size.
In most sane cases, you can live-stream data with uPlot at 60fps, though it may begin to struggle beyond 100k in-view points.
When updating 3,600 points at 60fps, uPlot uses 10% CPU and 12.3MB RAM.
The next fastest Canvas-based libs (Chart.js and ECharts) use 40% / 77MB and 70% / 85MB, respectively.
If you need to stream, give unclog your rendering pipeline a try.
If that does not help, consider reducing the update frequency or switch to a WebGL/WebGPU solution, like danchitnis/webgl-plot, huww98/TimeChart, epezent/implot.
A lean, consistent, and powerful API with hooks & plugins
Non-Features
In order to stay lean, fast and focused the following features will not be added:
No data parsing, aggregation, summation or statistical processing - just do it in advance. e.g. simples-statistics, https://github.com/leeoniya/uDSV
No transitions or animations - they're always pure distractions.
No collision avoidance for axis tick labels, so may require manual tweaking of spacing metrics if label customization significiantly increases default label widths.
No stacked series: see "Stacked Area Graphs Are Not Your Friend" and a horrific demo. While smooth spline interpolation is available, its use is strongly discouraged: Your data is misrepresented!. Both visualizations are terrible at accurately communicating information.
No built-in drag scrolling/panning due to ambiguous native zoom/selection behavior. However, this can be added externally via the plugin/hooks API: zoom-wheel, zoom-touch.
Documentation (WIP)
The docs are a perpetual work in progress, it seems.
Start with /docs/README.md for a conceptual overview.
The full API is further documented via comments in /dist/uPlot.d.ts.
Additionally, an ever-expanding collection of runnable /demos covers the vast majority of uPlot's API.
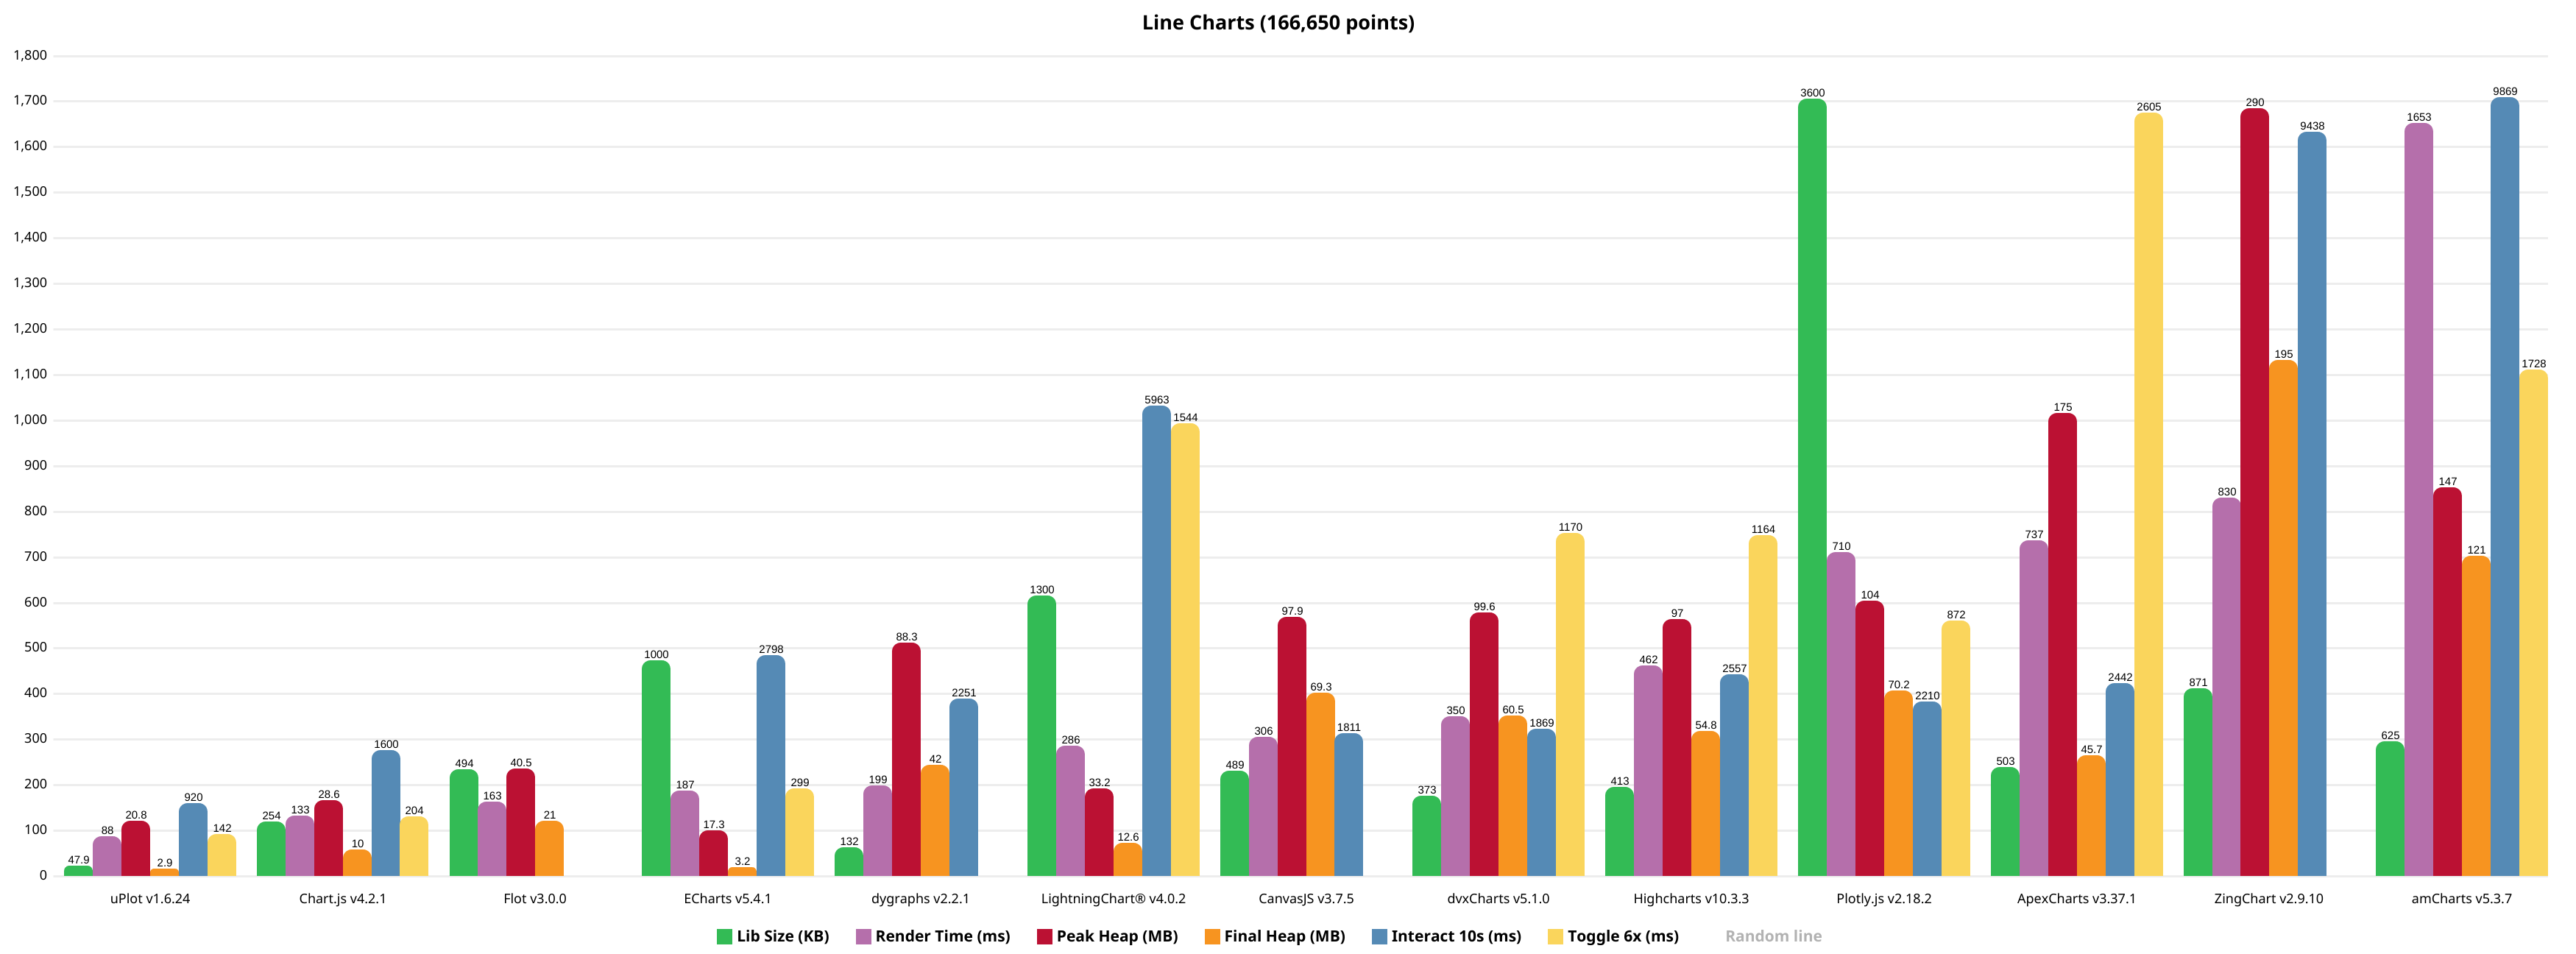
libs are sorted by their initial, cold-start, render performance (excluding network transfer time to download the lib)
size includes the lib itself plus any dependencies required to render the benchmark, e.g. Moment, jQuery, etc.
Flot does not make available any minified assets and all their examples use the uncompressed sources; they also use an uncompressed version of jQuery :/
Some libraries provide their own performance demos:
TODO (all of these use SVG, so performance should be similar to Highcharts):
Chartist.js
d3-based
C3.js
dc.js
MetricsGraphics
rickshaw
Unclog your rendering pipeline
Your browser's performance is highly dependent on your hardware, operating system, and GPU drivers.
If you're using a Chromium-based browser, there are some hidden settings that can unlock significant performance improvements for Canvas2D rendering.
Most of these have to do with where and how the rasterization is performed.
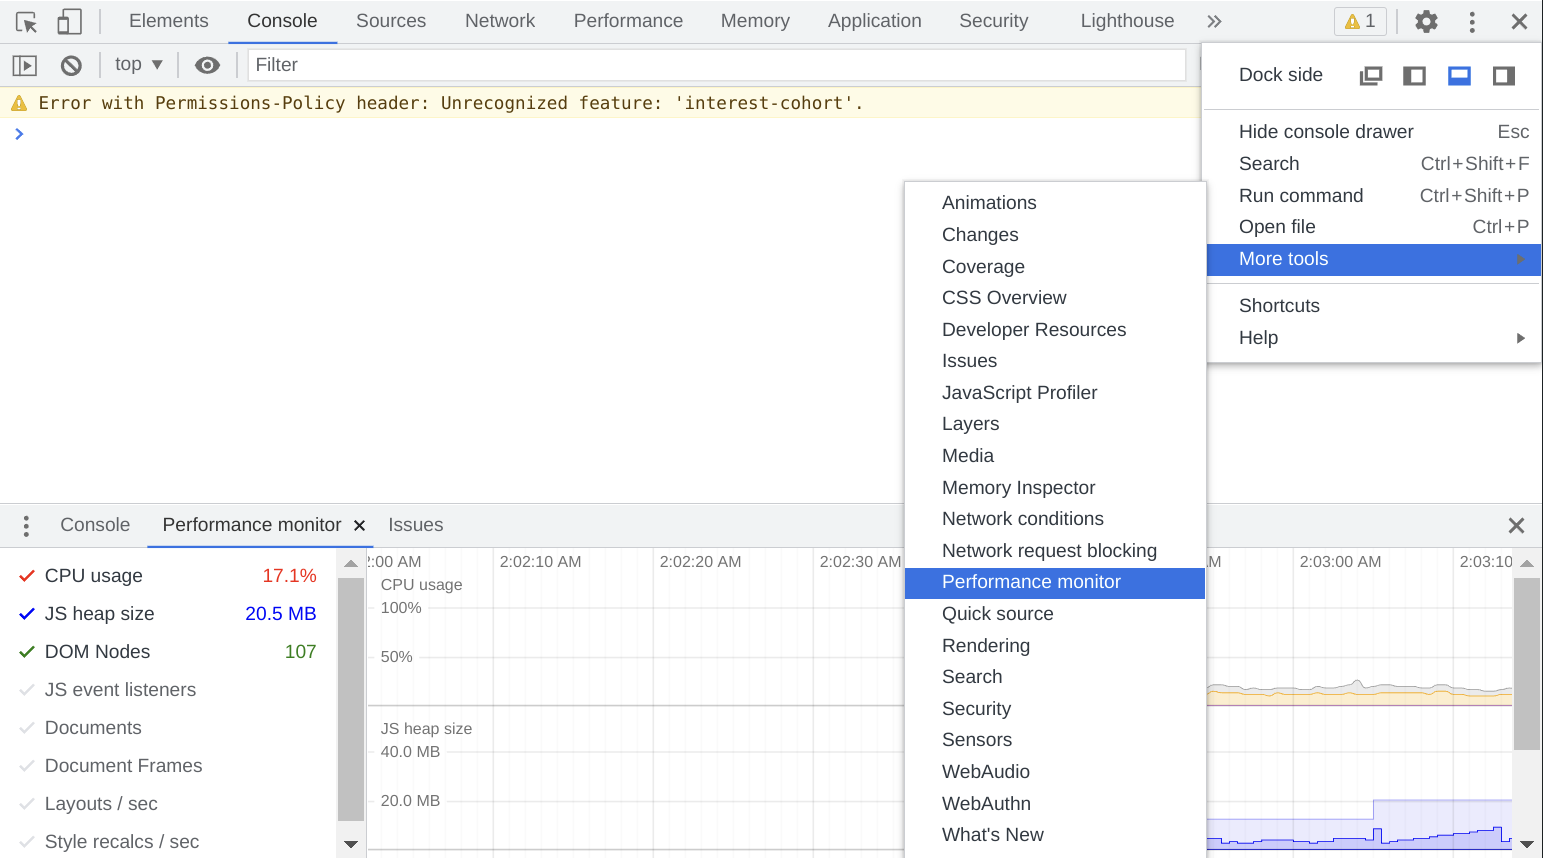
Head over to https://leeoniya.github.io/uPlot/demos/sine-stream.html and open up Chrome's DevTools (F12), then toggle the Performance Monitor.
For me:
On Windows 10 Desktop, Core i7-8700, 16GB RAM, AMD RX480 GPU, 2048 x 1080 resolution = 57% CPU usage
On Manjaro Laptop (Arch Linux), AMD Ryzen 7 PRO 5850U, 48GB RAM, AMD Radeon RX Vega 8 (integrated GPU), 4K resolution = 99% CPU usage
If your CPU is close to 100%, it may be rasterizing everything in the same CPU process.
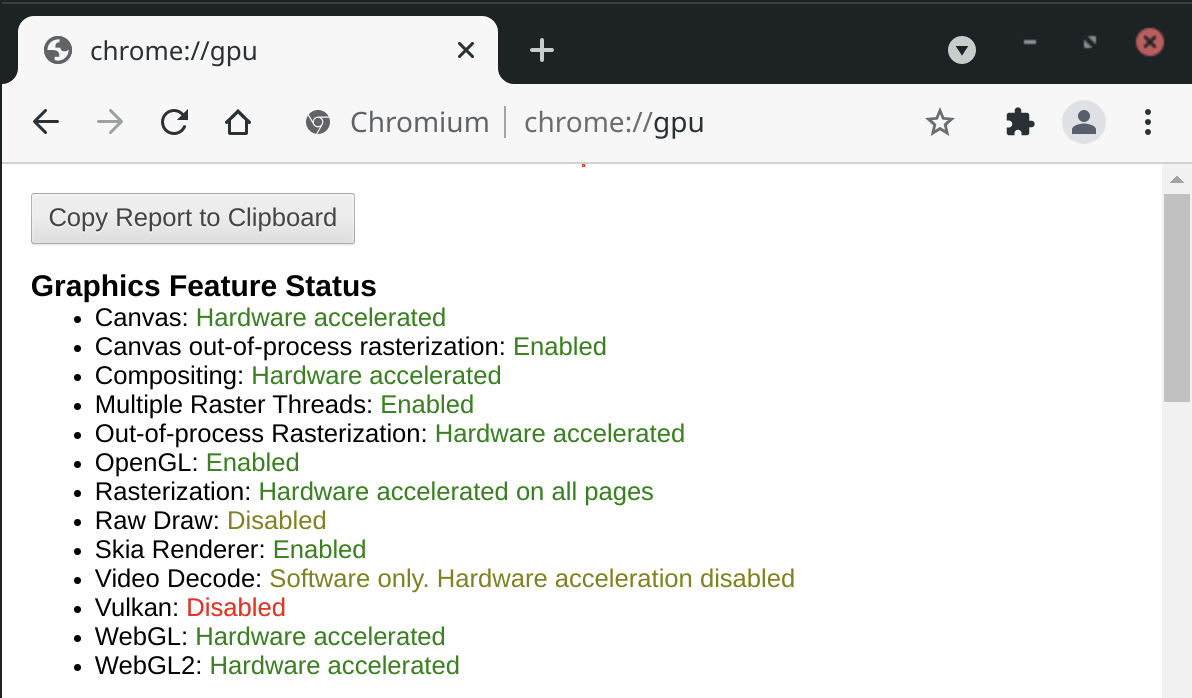
Pop open chrome://gpu and see what's orange or red.
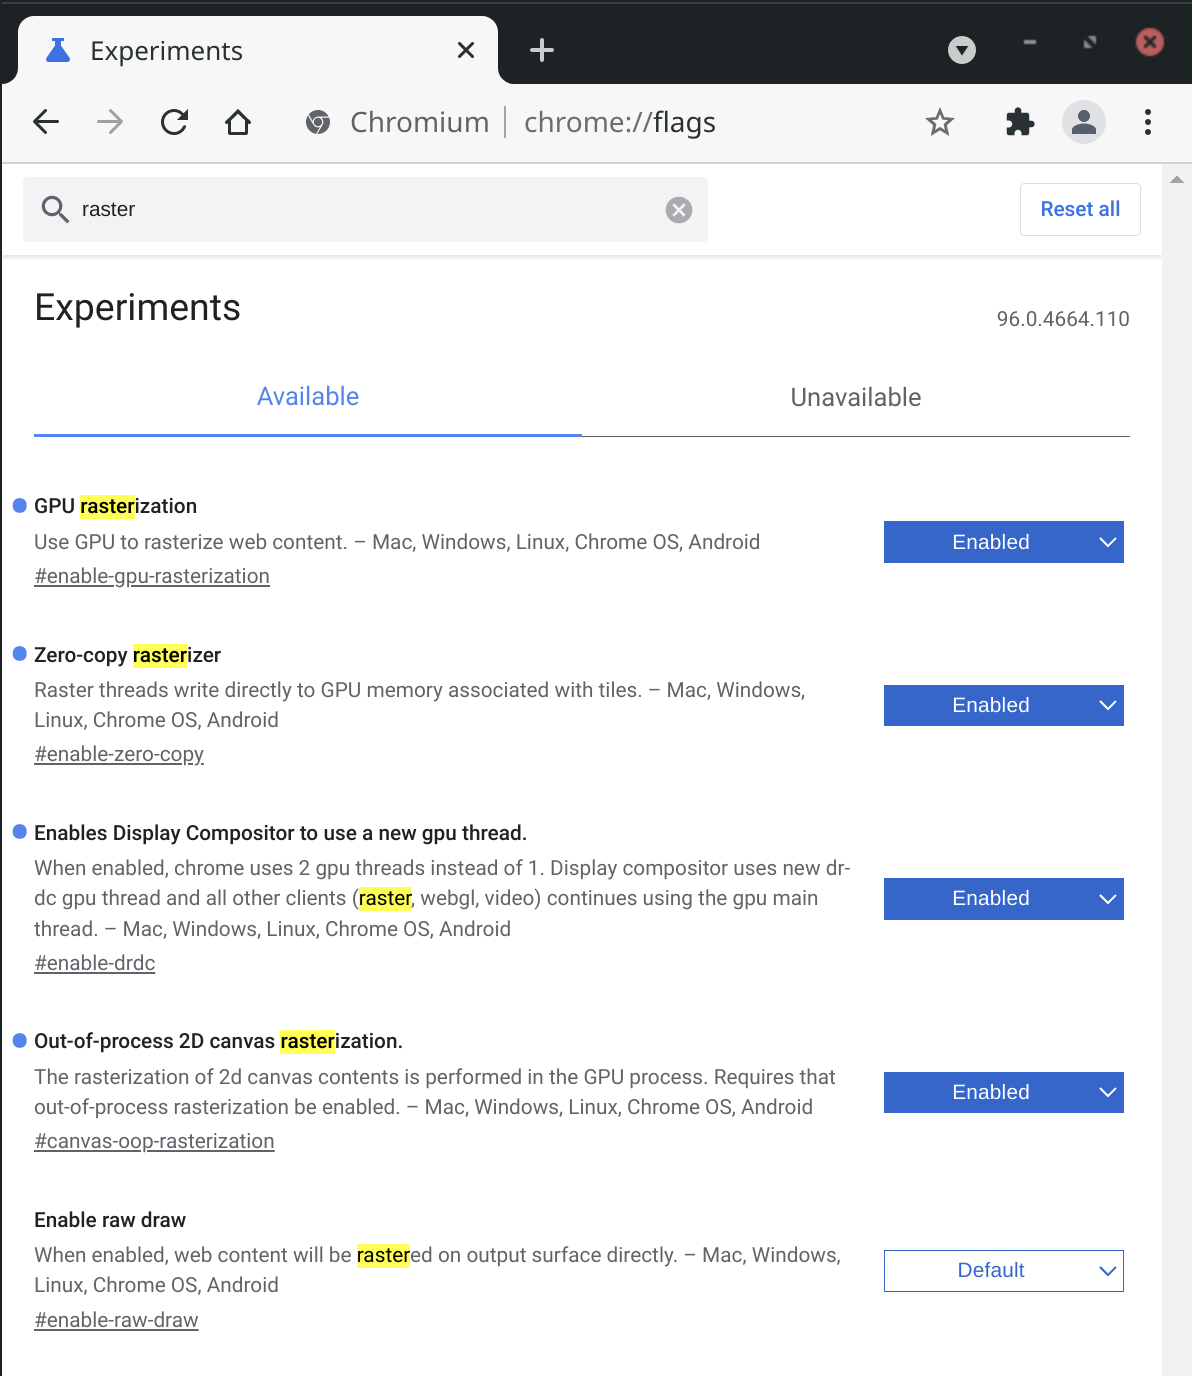
Then open chrome://flags and search for "raster" to see what can be force-enabled.
On my Manjaro/Ryzen/Integrated GPU setup, force-enabling Canvas out-of-process rasterization resulted in a dramatic framerate improvement.
On my Windows/i7/Dedicated GPU setup, toggling the same flags moved the work to another process (still good), but did not have a significant framerate impact.
YMMV!
Acknowledgements
Dan Vanderkam's dygraphs was a big inspiration; in fact, my stale pull request #948 was a primary motivator for μPlot's inception.
Adam Pearce for #15 - remove redundant lineTo commands.
leeoniya/uPlot thuộc nhóm Data trên TopGit, cùng 16 topic GitHub. Trang Trending và Topics liệt kê các repo cùng số sao và cùng ngôn ngữ để so sánh.
Đọc thêm về leeoniya/uPlot ở đâu?
Trang TopGit này là một snapshot — tab "Readme" hiển thị nguyên văn README của repo (đã bỏ link, giữ ảnh). Repo GitHub ở github.com/leeoniya/uPlot là nguồn chính thức.
leeoniya/uPlot có bao nhiêu sao?
leeoniya/uPlot có 10.4k sao GitHub — tải lại trang để xem số mới nhất, hoặc xem trực tiếp github.com/leeoniya/uPlot. TopGit phản chiếu số sao của GitHub nhưng không cam kết đến từng phút.
Commit gần nhất trên leeoniya/uPlot là 4 tháng trước (theo timestamp GitHub). Repo có 460 fork — một chỉ báo về mức độ quan tâm của cộng đồng.
leeoniya/uPlot viết bằng ngôn ngữ gì?
leeoniya/uPlot chủ yếu viết bằng JavaScript. Trường "language" của GitHub dựa trên phần lớn byte ở nhánh mặc định.
Vì sao leeoniya/uPlot được xếp vào nhóm Data?
TopGit xếp leeoniya/uPlot vào nhóm Data dựa trên GitHub topics và mô tả của repo (gắn thẻ: "analytics", "chart", "charts"). Việc phân loại dựa trên metadata thật của repo, không phải đoán theo cảm tính biên tập.
Đọc đầy đủ README ở tab phía trên.
Chưa chắc uPlot có hợp với bạn?
Để ChatGPT, Claude hoặc Perplexity tìm hiểu giúp — bấm bên dưới và xem AI nói gì về uPlot.
 /uPlot
 μPlot
μPlot