red-data-tools/YouPlot là dự án Ruby với 4.8k sao trong nhóm Developer Tools. A command line tool that draw plots on the terminal.
Tóm tắt dựng từ metadata GitHub của chính dự án — chưa có bài review TopGit. Trang sẽ tự động cập nhật khi bài review đầy đủ được xuất bản.
VÌ SAO CHƯA CÓ REVIEW
TopGit viết bài đầy đủ cho repo có nhiều sao nhất và được yêu cầu nhiều nhất. Trang này là snapshot trong thời gian chờ — xem README gốc ở tab READ ME.
Count the number of chromosomes where genes are located.
cat gencode.v35.annotation.gff3 \
| grep -v '#' | grep 'gene' | cut -f1 \
| uplot count -t "The number of human gene annotations per chromosome"  -c blue
GENCODE - Human Release
Note: count is not very fast because it runs in a Ruby script.
This is fine in most cases, as long as the data size is small. If you want to visualize huge data, it is faster to use a combination of common Unix commands as shown below.
cat gencode.v35.annotation.gff3 | grep -v '#' | grep 'gene' | cut -f1 \
| sort | uniq -c | sort -nrk1 \
| uplot bar --fmt yx -d ' ' -t "The number of human gene annotations per chromosome"  -c blue
Usage
Commands
uplot is the shortened form of youplot. You can use either.
Command
Description
cat data.tsv | uplot <command> [options]
Take input from stdin
uplot <command> [options] data.tsv ...
Take input from files
pipeline1 | uplot <command> -O | pipeline2
Outputs data from stdin to stdout
Subcommands
The following sub-commands are available.
command
short
how it works
barplot
bar
draw a horizontal barplot
histogram
hist
draw a horizontal histogram
lineplot
line
draw a line chart
lineplots
lines
draw a line chart with multiple series
scatter
s
draw a scatter plot
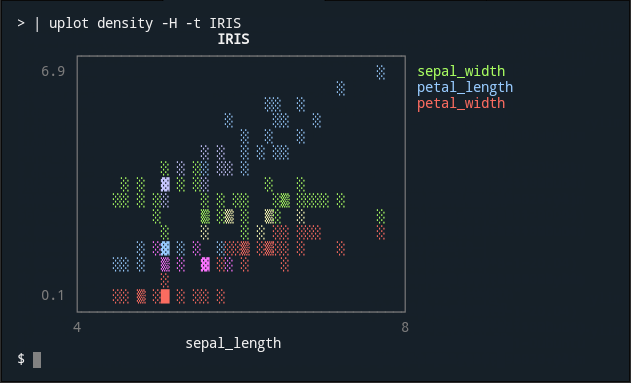
density
d
draw a density plot
boxplot
box
draw a horizontal boxplot
count
c
draw a barplot based on the number of occurrences (slow)
colors
color
show the list of available colors
Output the plot
-o
By default, the plot is output to standard error output.
If you want to output to standard output, Use hyphen -o - or no argument uplot s -o | .
Output the input data
-O
By default, the input data is not shown anywhere.
If you want to pass the input data directly to the standard output, Use hyphen -O - or no argument uplot s -O |.
This is useful when passing data to a subsequent pipeline.
Header
-H
If input data contains a header line, you need to specify the -H option.
Delimiter
-d
You do not need to use -d option for tab-delimited text since the default value is tab.
To specify a blank space, you can use uplot bar -d ' ' data.txt.
Real-time data
-p--progress
Experimental progressive mode is currently under development.
ruby -e 'loop{puts rand(100)}' | uplot line --progress
Show detailed options for subcommands
--help
The --help option will show more detailed options for each subcommand.
uplot hist --help
Set columns as x-axis or y-axis
YouPlot treats the first column as the X axis and the second column as the Y axis. When working with multiple series, the first column is the X axis, the second column is series Y1, the third column is series Y2, and so on.
If you pass only one column of data for line and bar, YouPlot will automatically use a sequential number starting from 1 as the X-axis.
--fmt
--fmt xyy--fmt xyxy--fmt yx options give you a few more choices. See youplot <command> --help for more details.
The fmt option may be renamed in the future.
The -x and -y options might be used to specify columns in the future.
Use awk '{print $2, $1}' to swap columns. Use paste to concatenate series.
Categorical data
With GNU datamash, you can manage to handle categorized data.
cat test/fixtures/iris.csv | sed '/^$/d' | datamash --header-in --output-delimiter=: -t, -g5 collapse 3,4 | cut -f2-3 -d: | sed 's/:/\n/g' | uplot s -d, -T --fmt xyxy
This is not so easy...
Time series
Not yet supported.
YouPlot Configuration (youplotrc)
You can specify default options in a configuration file in YAML format. For more information, enter the following command.
uplot --config
Tools that are useful to use with YouPlot
csvtk
GNU datamash
awk
xsv
Contributing
YouPlot is a library under development, so even small improvements like typofix are welcome!
Please feel free to send us your pull requests.
Report bugs
Fix bugs and submit pull requests
Write, clarify, or fix documentation
English corrections by native speakers are welcome.
Suggest or add new features
Make a donation
Development
Fork the main repository by clicking the Fork button.
red-data-tools/YouPlot thuộc nhóm Developer Tools trên TopGit, cùng 7 topic GitHub. Trang Trending và Topics liệt kê các repo cùng số sao và cùng ngôn ngữ để so sánh.
Đọc thêm về red-data-tools/YouPlot ở đâu?
Trang TopGit này là một snapshot — tab "Readme" hiển thị nguyên văn README của repo (đã bỏ link, giữ ảnh). Repo GitHub ở github.com/red-data-tools/YouPlot là nguồn chính thức.
red-data-tools/YouPlot có bao nhiêu sao?
red-data-tools/YouPlot có 4.8k sao GitHub — tải lại trang để xem số mới nhất, hoặc xem trực tiếp github.com/red-data-tools/YouPlot. TopGit phản chiếu số sao của GitHub nhưng không cam kết đến từng phút.
red-data-tools/YouPlot có phải mã nguồn mở không?
Có — red-data-tools/YouPlot phát hành theo license MIT, nghĩa là mã nguồn mở để đọc, fork và (tùy license) tái sử dụng. Mã: github.com/red-data-tools/YouPlot.
red-data-tools/YouPlot còn đang phát triển không?
Commit gần nhất trên red-data-tools/YouPlot là 1 tháng trước (theo timestamp GitHub). Repo có 68 fork — một chỉ báo về mức độ quan tâm của cộng đồng.
red-data-tools/YouPlot dùng license gì?
red-data-tools/YouPlot phát hành theo license MIT. Nên mở file LICENSE trên GitHub để xác nhận — license metadata đôi khi lệch với thực tế dự án.
red-data-tools/YouPlot là gì?
red-data-tools/YouPlot (red-data-tools/YouPlot) là dự án Ruby trên GitHub. Theo mô tả gốc: A command line tool that draw plots on the terminal.
red-data-tools/YouPlot viết bằng ngôn ngữ gì?
red-data-tools/YouPlot chủ yếu viết bằng Ruby. Trường "language" của GitHub dựa trên phần lớn byte ở nhánh mặc định.
Đọc đầy đủ README ở tab phía trên.
Chưa chắc YouPlot có hợp với bạn?
Để ChatGPT, Claude hoặc Perplexity tìm hiểu giúp — bấm bên dưới và xem AI nói gì về YouPlot.
 /YouPlot