Một mục mã nguồn mở trong kho dữ liệu GitHub của TopGit: vega/altair, 10.4k sao, Python. Declarative visualization library for Python
Tóm tắt dựng từ metadata GitHub của chính dự án — chưa có bài review TopGit. Trang sẽ tự động cập nhật khi bài review đầy đủ được xuất bản.
VÌ SAO CHƯA CÓ REVIEW
TopGit viết bài đầy đủ cho repo có nhiều sao nhất và được yêu cầu nhiều nhất. Trang này là snapshot trong thời gian chờ — xem README gốc ở tab READ ME.
Vega-Altair is a declarative statistical visualization library for Python. With Vega-Altair, you can spend more time understanding your data and its meaning. Vega-Altair's
API is simple, friendly and consistent and built on top of the powerful
Vega-Lite JSON specification. This elegant
simplicity produces beautiful and effective visualizations with a minimal amount of code.
Vega-Altair was originally developed by Jake Vanderplas and Brian
Granger in close collaboration with the UW
Interactive Data Lab.The Vega-Altair open source project is not affiliated with Altair Engineering, Inc.
Documentation
See Vega-Altair's Documentation Site as well as the Tutorial Notebooks. You can
run the notebooks directly in your browser by clicking on one of the following badges:
Example
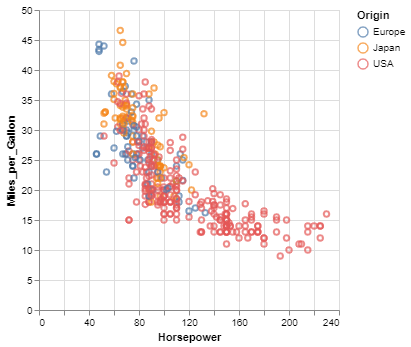
Here is an example using Vega-Altair to quickly visualize and display a dataset with the native Vega-Lite renderer in the JupyterLab:
import altair as alt

# load a simple dataset as a pandas DataFrame
from altair.datasets import data
cars = data.cars()

alt.Chart(cars).mark_point().encode(
    x='Horsepower',
    y='Miles_per_Gallon',
    color='Origin',
)
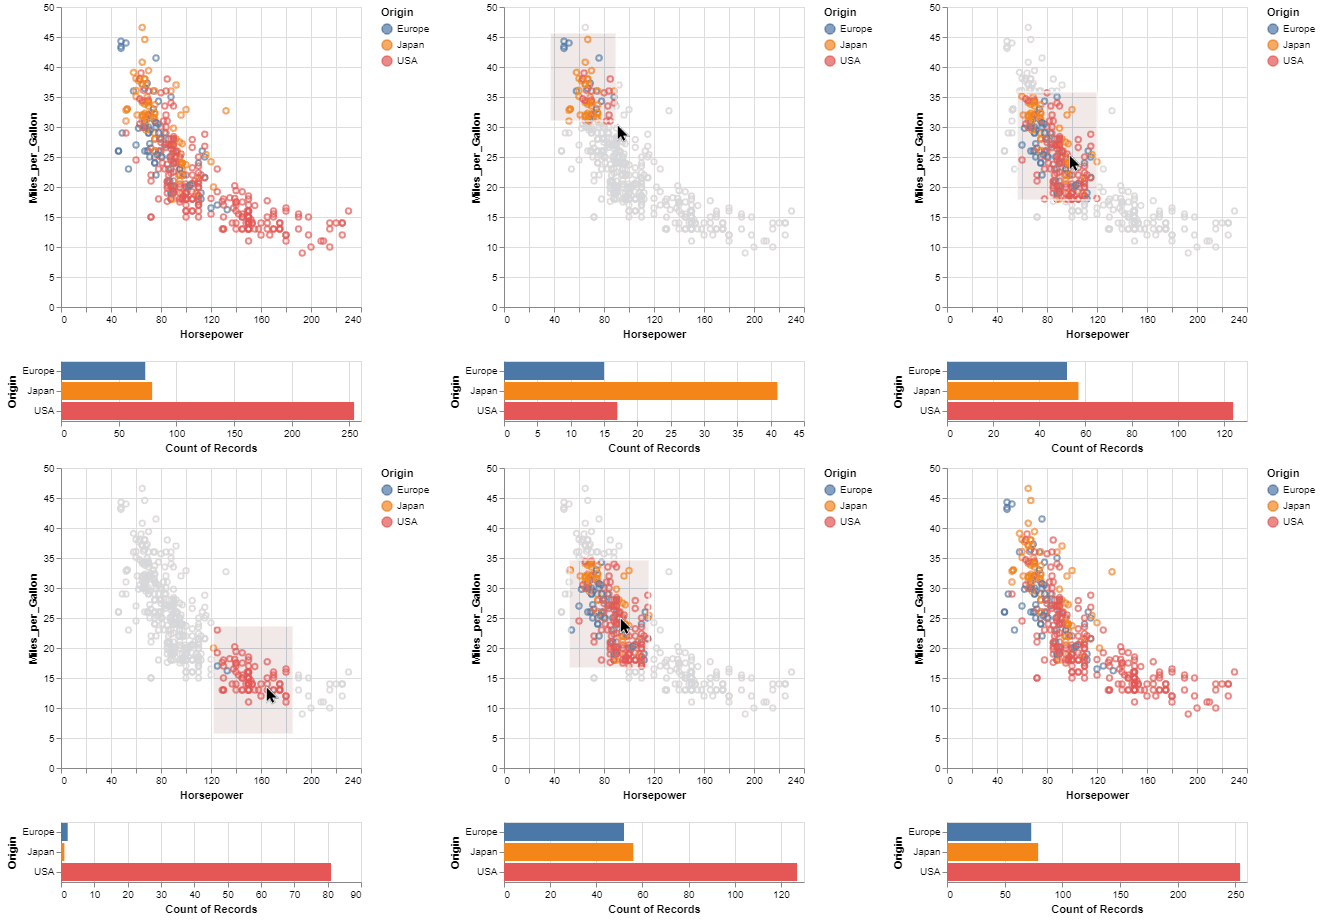
One of the unique features of Vega-Altair, inherited from Vega-Lite, is a declarative grammar of not just visualization, but interaction.
With a few modifications to the example above we can create a linked histogram that is filtered based on a selection of the scatter plot.
import altair as alt
from altair.datasets import data

source = data.cars()

brush = alt.selection_interval()

points = alt.Chart(source).mark_point().encode(
    x='Horsepower',
    y='Miles_per_Gallon',
    color=alt.when(brush).then("Origin").otherwise(alt.value("lightgray"))
).add_params(
    brush
)

bars = alt.Chart(source).mark_bar().encode(
    y='Origin',
    color='Origin',
    x='count(Origin)'
).transform_filter(
    brush
)

points & bars
Features
Carefully-designed, declarative Python API.
Auto-generated internal Python API that guarantees visualizations are type-checked and
in full conformance with the Vega-Lite
specification.
Display visualizations in JupyterLab, Jupyter Notebook, Visual Studio Code, on GitHub and
nbviewer, and many more.
Export visualizations to various formats such as PNG/SVG images, stand-alone HTML pages and the
Online Vega-Lite Editor.
Serialize visualizations as JSON files.
Installation
Vega-Altair can be installed with:
pip install altair
If you are using the conda package manager, the equivalent is:
conda install altair -c conda-forge
For full installation instructions, please see the documentation.
Getting Help
If you have a question that is not addressed in the documentation,
you can post it on StackOverflow using the altair tag.
For bugs and feature requests, please open a Github Issue.
Development
For information on how to contribute your developments back to the Vega-Altair repository, see
CONTRIBUTING.md
Citing Vega-Altair
If you use Vega-Altair in academic work, please consider citing https://joss.theoj.org/papers/10.21105/joss.01057 as
@article{VanderPlas2018,
    doi = {10.21105/joss.01057},
    url = {https://doi.org/10.21105/joss.01057},
    year = {2018},
    publisher = {The Open Journal},
    volume = {3},
    number = {32},
    pages = {1057},
    author = {Jacob VanderPlas and Brian Granger and Jeffrey Heer and Dominik Moritz and Kanit Wongsuphasawat and Arvind Satyanarayan and Eitan Lees and Ilia Timofeev and Ben Welsh and Scott Sievert},
    title = {Altair: Interactive Statistical Visualizations for Python},
    journal = {Journal of Open Source Software}
}
Please additionally consider citing the Vega-Lite project, which Vega-Altair is based on: https://dl.acm.org/doi/10.1109/TVCG.2016.2599030
@article{Satyanarayan2017,
    author={Satyanarayan, Arvind and Moritz, Dominik and Wongsuphasawat, Kanit and Heer, Jeffrey},
    title={Vega-Lite: A Grammar of Interactive Graphics},
    journal={IEEE transactions on visualization and computer graphics},
    year={2017},
    volume={23},
    number={1},
    pages={341-350},
    publisher={IEEE}
}
Trang TopGit này là một snapshot — tab "Readme" hiển thị nguyên văn README của repo (đã bỏ link, giữ ảnh). Repo GitHub ở github.com/vega/altair là nguồn chính thức.
vega/altair có bao nhiêu sao?
vega/altair có 10.4k sao GitHub — tải lại trang để xem số mới nhất, hoặc xem trực tiếp github.com/vega/altair. TopGit phản chiếu số sao của GitHub nhưng không cam kết đến từng phút.
vega/altair có phải mã nguồn mở không?
Có — vega/altair phát hành theo license BSD-3-Clause, nghĩa là mã nguồn mở để đọc, fork và (tùy license) tái sử dụng. Mã: github.com/vega/altair.
vega/altair còn đang phát triển không?
Commit gần nhất trên vega/altair là 18 ngày trước (theo timestamp GitHub). Repo có 866 fork — một chỉ báo về mức độ quan tâm của cộng đồng.
vega/altair dùng license gì?
vega/altair phát hành theo license BSD-3-Clause. Nên mở file LICENSE trên GitHub để xác nhận — license metadata đôi khi lệch với thực tế dự án.
vega/altair là gì?
vega/altair (vega/altair) là dự án Python trên GitHub. Theo mô tả gốc: Declarative visualization library for Python
vega/altair viết bằng ngôn ngữ gì?
vega/altair chủ yếu viết bằng Python. Trường "language" của GitHub dựa trên phần lớn byte ở nhánh mặc định.
Đọc đầy đủ README ở tab phía trên.
Chưa chắc altair có hợp với bạn?
Để ChatGPT, Claude hoặc Perplexity tìm hiểu giúp — bấm bên dưới và xem AI nói gì về altair.
 /altair