As a backend project, ranaroussi/quantstats has picked up 7.5k stars on GitHub (Python). Portfolio analytics for quants, written in Python
Snapshot summary built from the project's own GitHub metadata — there's no written TopGit review yet. The page will update automatically when a full review is published.
WHY NO REVIEW YET
TopGit writes full reviews for the most-starred, most-requested repositories. This page is a snapshot until then — see the READ ME tab for the original README in full.
QuantStats Python library that performs portfolio profiling, allowing quants and portfolio managers to understand their performance better by providing them with in-depth analytics and risk metrics.
Changelog »
QuantStats is comprised of 3 main modules:
quantstats.stats - for calculating various performance metrics, like Sharpe ratio, Win rate, Volatility, etc.
quantstats.plots - for visualizing performance, drawdowns, rolling statistics, monthly returns, etc.
quantstats.reports - for generating metrics reports, batch plotting, and creating tear sheets that can be saved as an HTML file.
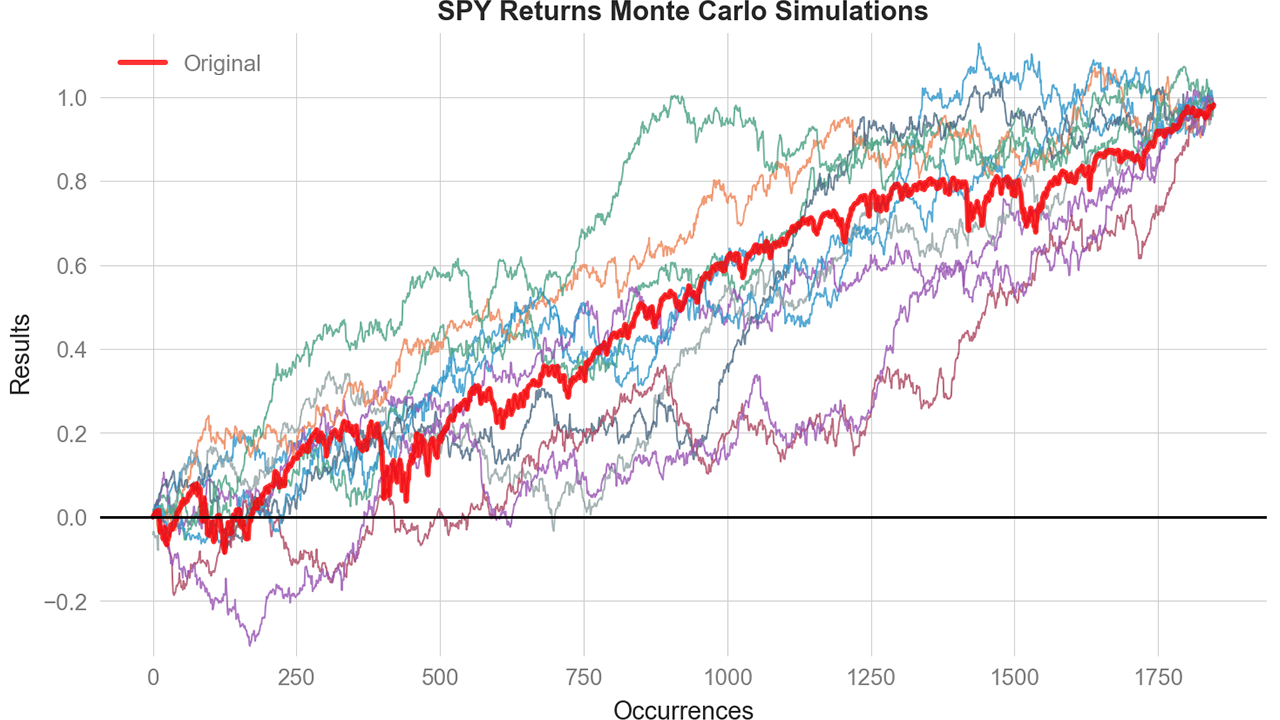
NEW! Monte Carlo Simulations
Run probabilistic risk analysis with built-in Monte Carlo simulations:
%matplotlib inline
import quantstats as qs

# extend pandas functionality with metrics, etc.
qs.extend_pandas()

# fetch the daily returns for a stock
stock = qs.utils.download_returns('META')

# show sharpe ratio
qs.stats.sharpe(stock)

# or using extend_pandas() :)
stock.sharpe()
Output:
0.7604779884378278
Visualize stock performance
qs.plots.snapshot(stock, title='Facebook Performance', show=True)

# can also be called via:
# stock.plot_snapshot(title='Facebook Performance', show=True)
QuantStats analyzes return series (daily, weekly, monthly returns), not discrete trade data. This means:
Win Rate = percentage of periods with positive returns
Consecutive Wins/Losses = consecutive positive/negative return periods
Payoff Ratio = average winning period return / average losing period return
Profit Factor = sum of positive returns / sum of negative returns
These metrics are valid and useful for:
Systematic/algorithmic strategies with regular rebalancing
Analyzing return-series behavior over time
Comparing strategies on a period-by-period basis
For discretionary traders with multi-day trades, these period-based metrics may differ from trade-level statistics. A single 5-day trade might span 3 positive days and 2 negative days - QuantStats would count these as 3 "wins" and 2 "losses" at the daily level.
This is consistent with how all return-based analytics work (Sharpe ratio, Sortino ratio, drawdown analysis, etc.) - they operate on return periods, not discrete trade entries/exits.
In the meantime, you can get insights as to optional parameters for each method, by using Python's help method:
help(qs.stats.conditional_value_at_risk)
Help on function conditional_value_at_risk in module quantstats.stats:

conditional_value_at_risk(returns, sigma=1, confidence=0.99)
    calculates the conditional daily value-at-risk (aka expected shortfall)
    quantifies the amount of tail risk an investment
Installation
Install using pip:
$ pip install quantstats --upgrade --no-cache-dir
Install using conda:
$ conda install -c ranaroussi quantstats
Requirements
Python >= 3.10
pandas >= 1.5.0
numpy >= 1.24.0
scipy >= 1.11.0
matplotlib >= 3.7.0
seaborn >= 0.13.0
tabulate >= 0.9.0
yfinance >= 0.2.40
plotly >= 5.0.0 (optional, for using plots.to_plotly())
Questions?
This is a new library... If you find a bug, please
open an issue.
If you'd like to contribute, a great place to look is the
issues marked with help-wanted.
Known Issues
For some reason, I couldn't find a way to tell seaborn not to return the
monthly returns heatmap when instructed to save - so even if you save the plot (by passing savefig={...}) it will still show the plot.
Legal Stuff
QuantStats is distributed under the Apache Software License. See the LICENSE.txt file in the release for details.
Does ranaroussi/quantstats have a project website?
No homepage URL was recorded for ranaroussi/quantstats in TopGit's last sync. The README tab above frequently contains screenshots and demo links, or check the repository description on GitHub.
How does ranaroussi/quantstats compare to other Backend projects?
ranaroussi/quantstats is tracked by TopGit in the Backend category, with 7.5k GitHub stars and written in Python. Browse the Backend topic page on TopGit to compare it against similar projects by stars and activity.
How many stars does ranaroussi/quantstats have?
ranaroussi/quantstats has 7.5k GitHub stars — refresh the page for the live number, or check github.com/ranaroussi/quantstats. TopGit mirrors GitHub's count but does not claim minute-by-minute accuracy.
Is ranaroussi/quantstats open source?
Yes — ranaroussi/quantstats ships under the Apache-2.0 license, which makes its source code freely readable (and, depending on license terms, forkable and reusable). Source: github.com/ranaroussi/quantstats.
What else is in the Backend space?
ranaroussi/quantstats is tracked by TopGit under the Backend category, alongside 11 GitHub-tagged topics. Trending and Topics pages list peer repositories of comparable stars and language.
What is ranaroussi/quantstats?
ranaroussi/quantstats (ranaroussi/quantstats) is a Python project on GitHub. From the project's own README: Portfolio analytics for quants, written in Python
Where do I read more about ranaroussi/quantstats?
This TopGit page is a snapshot — the READ ME tab shows the project's own README content (links stripped, images preserved). The GitHub repository at github.com/ranaroussi/quantstats is the definitive source.
Read full README in the tab above.
Is quantstats worth your time?
ChatGPT, Claude and Perplexity can all read this page. Ask one of them what it makes of quantstats.
 /quantstats