ranaroussi/quantstats là một trong những repo phía máy chủ mà TopGit theo dõi, hiện có 7.9k sao, viết chủ yếu bằng Python. Portfolio analytics for quants, written in Python
Tóm tắt dựng từ metadata GitHub của chính dự án — chưa có bài review TopGit. Trang sẽ tự động cập nhật khi bài review đầy đủ được xuất bản.
VÌ SAO CHƯA CÓ REVIEW
TopGit viết bài đầy đủ cho repo có nhiều sao nhất và được yêu cầu nhiều nhất. Trang này là snapshot trong thời gian chờ — xem README gốc ở tab READ ME.
QuantStats Python library that performs portfolio profiling, allowing quants and portfolio managers to understand their performance better by providing them with in-depth analytics and risk metrics.
Changelog »
QuantStats is comprised of 3 main modules:
quantstats.stats - for calculating various performance metrics, like Sharpe ratio, Win rate, Volatility, etc.
quantstats.plots - for visualizing performance, drawdowns, rolling statistics, monthly returns, etc.
quantstats.reports - for generating metrics reports, batch plotting, and creating tear sheets that can be saved as an HTML file.
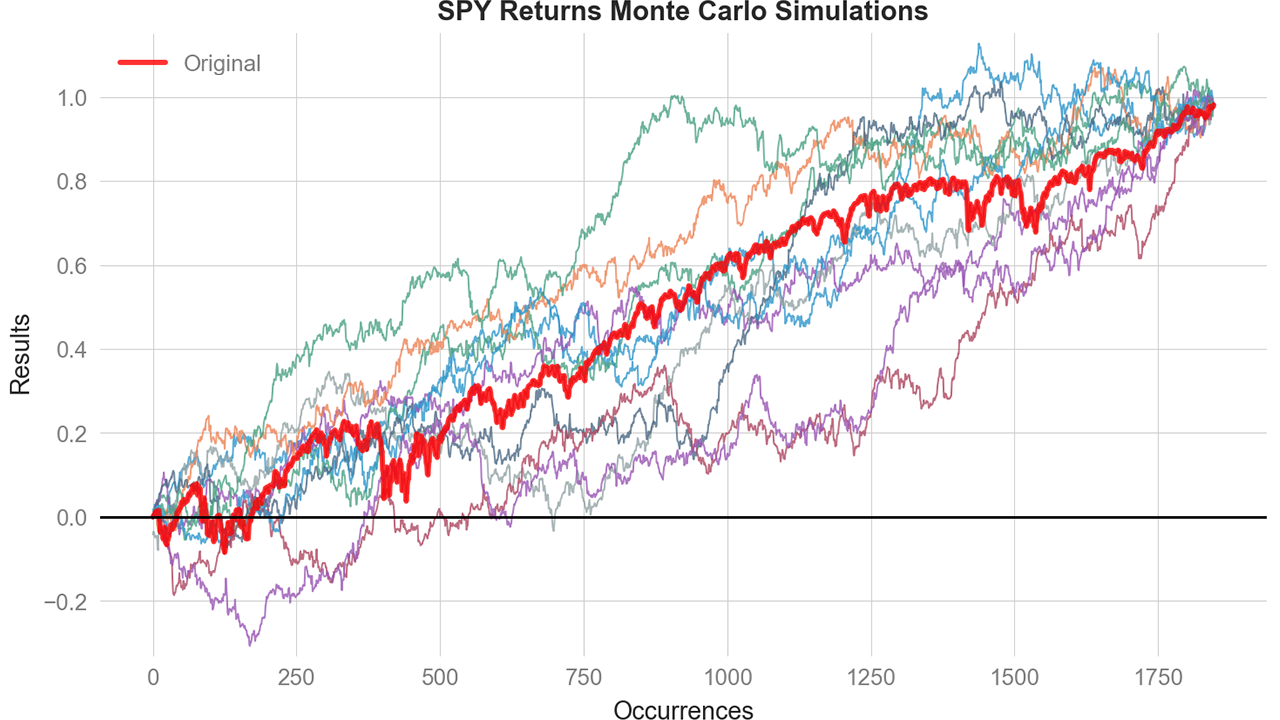
NEW! Monte Carlo Simulations
Run probabilistic risk analysis with built-in Monte Carlo simulations:
%matplotlib inline
import quantstats as qs

# extend pandas functionality with metrics, etc.
qs.extend_pandas()

# fetch the daily returns for a stock
stock = qs.utils.download_returns('META')

# show sharpe ratio
qs.stats.sharpe(stock)

# or using extend_pandas() :)
stock.sharpe()
Output:
0.7604779884378278
Visualize stock performance
qs.plots.snapshot(stock, title='Facebook Performance', show=True)

# can also be called via:
# stock.plot_snapshot(title='Facebook Performance', show=True)
QuantStats analyzes return series (daily, weekly, monthly returns), not discrete trade data. This means:
Win Rate = percentage of periods with positive returns
Consecutive Wins/Losses = consecutive positive/negative return periods
Payoff Ratio = average winning period return / average losing period return
Profit Factor = sum of positive returns / sum of negative returns
These metrics are valid and useful for:
Systematic/algorithmic strategies with regular rebalancing
Analyzing return-series behavior over time
Comparing strategies on a period-by-period basis
For discretionary traders with multi-day trades, these period-based metrics may differ from trade-level statistics. A single 5-day trade might span 3 positive days and 2 negative days - QuantStats would count these as 3 "wins" and 2 "losses" at the daily level.
This is consistent with how all return-based analytics work (Sharpe ratio, Sortino ratio, drawdown analysis, etc.) - they operate on return periods, not discrete trade entries/exits.
In the meantime, you can get insights as to optional parameters for each method, by using Python's help method:
help(qs.stats.conditional_value_at_risk)
Help on function conditional_value_at_risk in module quantstats.stats:

conditional_value_at_risk(returns, sigma=1, confidence=0.95, prepare_returns=True, method='parametric')
    Calculate the Conditional Value at Risk (CVaR), also known as Expected Shortfall.

    CVaR measures the expected loss given that a loss exceeds the VaR threshold.
    It quantifies the amount of tail risk an investment faces, providing a more
    comprehensive risk measure than VaR alone.
Installation
Install using pip:
$ pip install quantstats --upgrade --no-cache-dir
Install using conda:
$ conda install -c ranaroussi quantstats
Requirements
Python >= 3.10
pandas >= 1.5.0
numpy >= 1.24.0
scipy >= 1.11.0
matplotlib >= 3.7.0
seaborn >= 0.13.0
tabulate >= 0.9.0
yfinance >= 0.2.40
plotly >= 5.0.0 (optional, for using plots.to_plotly())
Questions?
This is a new library... If you find a bug, please
open an issue.
If you'd like to contribute, a great place to look is the
issues marked with help-wanted.
Known Issues
For some reason, I couldn't find a way to tell seaborn not to return the
monthly returns heatmap when instructed to save - so even if you save the plot (by passing savefig={...}) it will still show the plot.
Legal Stuff
QuantStats is distributed under the Apache Software License. See the LICENSE.txt file in the release for details.
ranaroussi/quantstats thuộc nhóm Backend trên TopGit, cùng 11 topic GitHub. Trang Trending và Topics liệt kê các repo cùng số sao và cùng ngôn ngữ để so sánh.
Đọc thêm về ranaroussi/quantstats ở đâu?
Trang TopGit này là một snapshot — tab "Readme" hiển thị nguyên văn README của repo (đã bỏ link, giữ ảnh). Repo GitHub ở github.com/ranaroussi/quantstats là nguồn chính thức.
ranaroussi/quantstats có bao nhiêu sao?
ranaroussi/quantstats có 7.9k sao GitHub — tải lại trang để xem số mới nhất, hoặc xem trực tiếp github.com/ranaroussi/quantstats. TopGit phản chiếu số sao của GitHub nhưng không cam kết đến từng phút.
ranaroussi/quantstats có phải mã nguồn mở không?
Có — ranaroussi/quantstats phát hành theo license Apache-2.0, nghĩa là mã nguồn mở để đọc, fork và (tùy license) tái sử dụng. Mã: github.com/ranaroussi/quantstats.
ranaroussi/quantstats có website riêng không?
TopGit chưa ghi nhận URL trang chủ cho ranaroussi/quantstats. Phần README ở tab phía trên thường có link demo, hoặc xem mô tả GitHub của repo.
ranaroussi/quantstats là gì?
ranaroussi/quantstats (ranaroussi/quantstats) là dự án Python trên GitHub. Theo mô tả gốc: Portfolio analytics for quants, written in Python
ranaroussi/quantstats so với các dự án Backend khác thế nào?
ranaroussi/quantstats được TopGit xếp vào nhóm Backend, với 7.9k sao GitHub và viết bằng Python. Xem trang chủ đề Backend trên TopGit để so sánh với các dự án tương tự theo số sao và mức độ hoạt động.
Đọc đầy đủ README ở tab phía trên.
Chưa chắc quantstats có hợp với bạn?
Để ChatGPT, Claude hoặc Perplexity tìm hiểu giúp — bấm bên dưới và xem AI nói gì về quantstats.

 /quantstats