ujjwalkarn/xda is a R project with 118 stars in the Data space. R package for exploratory data analysis
Snapshot summary built from the project's own GitHub metadata — there's no written TopGit review yet. The page will update automatically when a full review is published.
WHY NO REVIEW YET
TopGit writes full reviews for the most-starred, most-requested repositories. This page is a snapshot until then — see the READ ME tab for the original README in full.
This package contains several tools to perform initial exploratory analysis on any input dataset. It includes custom functions for plotting the data as well as performing different kinds of analyses such as univariate, bivariate and multivariate investigation which is the first step of any predictive modeling pipeline. This package can be used to get a good sense of any dataset before jumping on to building predictive models.
The package is constantly under development and more functionalities will be added soon. Pull requests to add more functions are welcome!
The functions currently included in the package are mentioned below:
numSummary(mydata) function automatically detects all numeric columns in the dataframe mydata and provides their summary statistics
charSummary(mydata) function automatically detects all character columns in the dataframe mydata and provides their summary statistics
Plot(mydata, dep.var) plots all independent variables in the dataframe mydata against the dependant variable specified by the dep.var parameter
removeSpecial(mydata, vec) replaces all special characters (specified by vector vec) in the dataframe mydata with NA
bivariate(mydata, dep.var, indep.var) performs bivariate analysis between dependent variable dep.var and independent variable indep.var in the dataframe mydata
More functions to be added soon.
Note: All functions mentioned above expect mydata to be a data.frame - please convert your input dataset to a data.frame before using any function from this package.
Installation
The best way to install xda package is to install devtools package first. To install devtools, please follow instructions here. Then, use the following commands to install xda:
For examples below, the popular iris dataset and the warpbreaks dataset has been used. Please refer to the documentation of each function to understand how to use it. For example, to see the documenation for the numSummary() function, use ?numSummary.
## load the package into the current session

library(xda)
numSummary()
## to view a comprehensive summary for all numeric columns in the iris dataset

numSummary(iris)

## n = total number of rows for that variable
## nunique = number of unique values
## nzeroes = number of zeroes
## iqr = interquartile range
## noutlier = number of outliers
## miss = number of rows with missing value
## miss% = percentage of total rows with missing values ((miss/n)*100)
## 5% = 5th percentile value of that variable (value below which 5 percent of the observations may be found)
## the percentile values are helpful in detecting outliers
## to view a comprehensive summary for all character columns in the warpbreaks dataset

charSummary(warpbreaks)

## n = total number of rows for that variable
## miss = number of rows with missing value
## miss% = percentage of total rows with missing values ((n/miss)*100)
## unique = number of unique levels of that variable
## top5levels:count = top 5 levels (unique values) in each column sorted by count
## for example, wool has 2 unique levels 'A' and 'B' each with count of 27
## to perform bivariate analysis between 'Species' and 'Sepal.Length' in the iris dataset

bivariate(iris,'Species','Sepal.Length')

## bin_Sepal.Length = 'Sepal.Length' variable has been binned into 4 equal intervals (original range is [4.3,7.9])
## for each interval of 'Sepal.Length', the number of samples from each category of 'Species' is shown
## i.e. 39 of the 50 samples of Setosa have Sepal.Length is in the range (4.3,5.2], and so on.
## the number of intervals (4 in this case) can be customized (see documentation)
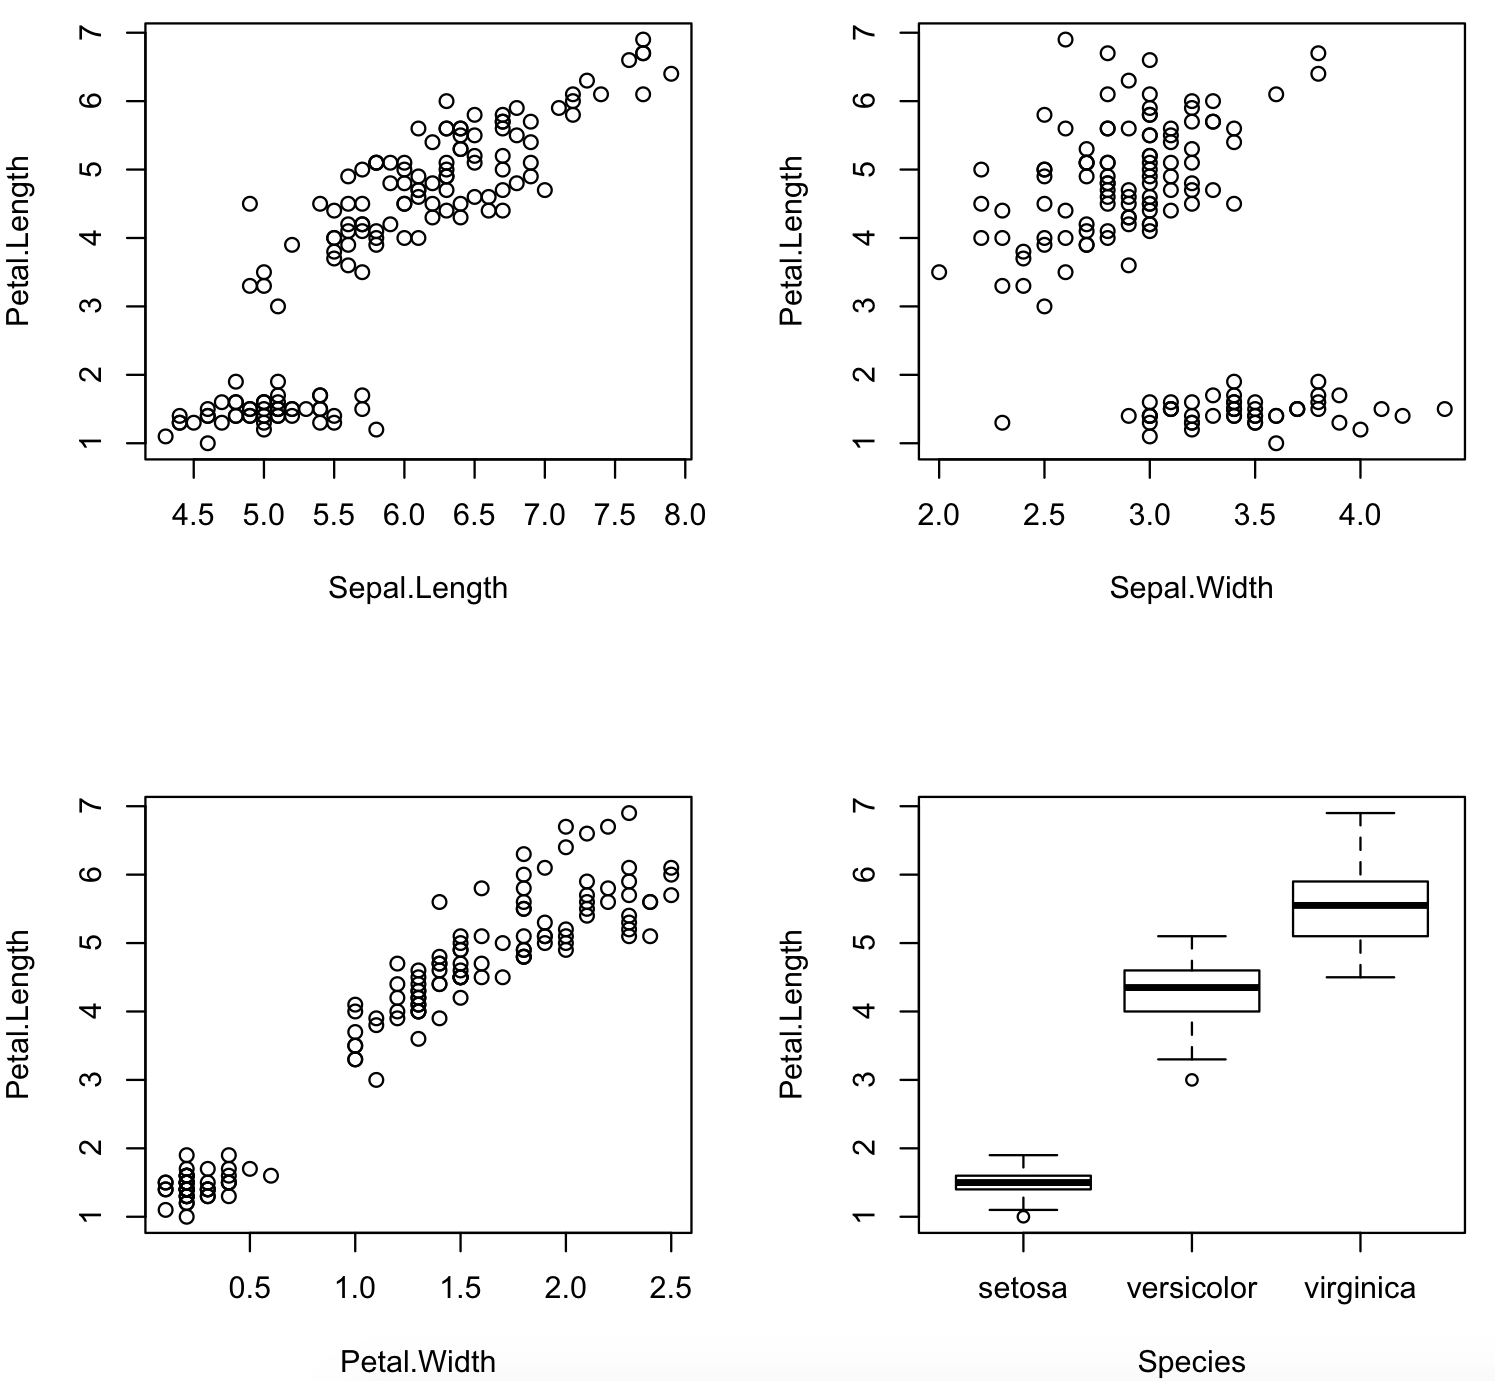
## to plot all other variables against the 'Petal.Length' variable in the iris dataset

Plot(iris,'Petal.Length')

## some interesting patterns can be seen in the plots below and these insights can be used for predictive modeling
The most recent commit recorded on ujjwalkarn/xda was 8.8 years ago, based on the GitHub push timestamp. The repository has 47 forks — one of the better signals of community interest.
How many stars does ujjwalkarn/xda have?
ujjwalkarn/xda has 118 GitHub stars — refresh the page for the live number, or check github.com/ujjwalkarn/xda. TopGit mirrors GitHub's count but does not claim minute-by-minute accuracy.
What else is in the Data space?
ujjwalkarn/xda is tracked by TopGit under the Data category, alongside 4 GitHub-tagged topics. Trending and Topics pages list peer repositories of comparable stars and language.
What language is ujjwalkarn/xda written in?
ujjwalkarn/xda is written primarily in R. GitHub's language field is based on the largest share of bytes in the default branch.
What topics is ujjwalkarn/xda associated with?
GitHub's repository topics for ujjwalkarn/xda: "data-analysis", "data-science", "exploratory-data-analysis", "r". TopGit's editorial category is Data.
Where do I read more about ujjwalkarn/xda?
This TopGit page is a snapshot — the READ ME tab shows the project's own README content (links stripped, images preserved). The GitHub repository at github.com/ujjwalkarn/xda is the definitive source.
Why is ujjwalkarn/xda categorized under Data?
TopGit places ujjwalkarn/xda in the Data category based on its GitHub topics and description (tagged: "data-analysis", "data-science", "exploratory-data-analysis"). Categories are assigned from real repository metadata, not editorial guesswork.
Read full README in the tab above.
Curious whether xda is right for you?
Let ChatGPT, Claude, or Perplexity look into it — click below and see what AI actually says about xda.

 /xda