Được TopGit lập chỉ mục từ metadata GitHub: ujjwalkarn/xda có 118 sao, viết chủ yếu bằng R. R package for exploratory data analysis
Tóm tắt dựng từ metadata GitHub của chính dự án — chưa có bài review TopGit. Trang sẽ tự động cập nhật khi bài review đầy đủ được xuất bản.
VÌ SAO CHƯA CÓ REVIEW
TopGit viết bài đầy đủ cho repo có nhiều sao nhất và được yêu cầu nhiều nhất. Trang này là snapshot trong thời gian chờ — xem README gốc ở tab READ ME.
This package contains several tools to perform initial exploratory analysis on any input dataset. It includes custom functions for plotting the data as well as performing different kinds of analyses such as univariate, bivariate and multivariate investigation which is the first step of any predictive modeling pipeline. This package can be used to get a good sense of any dataset before jumping on to building predictive models.
The package is constantly under development and more functionalities will be added soon. Pull requests to add more functions are welcome!
The functions currently included in the package are mentioned below:
numSummary(mydata) function automatically detects all numeric columns in the dataframe mydata and provides their summary statistics
charSummary(mydata) function automatically detects all character columns in the dataframe mydata and provides their summary statistics
Plot(mydata, dep.var) plots all independent variables in the dataframe mydata against the dependant variable specified by the dep.var parameter
removeSpecial(mydata, vec) replaces all special characters (specified by vector vec) in the dataframe mydata with NA
bivariate(mydata, dep.var, indep.var) performs bivariate analysis between dependent variable dep.var and independent variable indep.var in the dataframe mydata
More functions to be added soon.
Note: All functions mentioned above expect mydata to be a data.frame - please convert your input dataset to a data.frame before using any function from this package.
Installation
The best way to install xda package is to install devtools package first. To install devtools, please follow instructions here. Then, use the following commands to install xda:
For examples below, the popular iris dataset and the warpbreaks dataset has been used. Please refer to the documentation of each function to understand how to use it. For example, to see the documenation for the numSummary() function, use ?numSummary.
## load the package into the current session

library(xda)
numSummary()
## to view a comprehensive summary for all numeric columns in the iris dataset

numSummary(iris)

## n = total number of rows for that variable
## nunique = number of unique values
## nzeroes = number of zeroes
## iqr = interquartile range
## noutlier = number of outliers
## miss = number of rows with missing value
## miss% = percentage of total rows with missing values ((miss/n)*100)
## 5% = 5th percentile value of that variable (value below which 5 percent of the observations may be found)
## the percentile values are helpful in detecting outliers
## to view a comprehensive summary for all character columns in the warpbreaks dataset

charSummary(warpbreaks)

## n = total number of rows for that variable
## miss = number of rows with missing value
## miss% = percentage of total rows with missing values ((n/miss)*100)
## unique = number of unique levels of that variable
## top5levels:count = top 5 levels (unique values) in each column sorted by count
## for example, wool has 2 unique levels 'A' and 'B' each with count of 27
## to perform bivariate analysis between 'Species' and 'Sepal.Length' in the iris dataset

bivariate(iris,'Species','Sepal.Length')

## bin_Sepal.Length = 'Sepal.Length' variable has been binned into 4 equal intervals (original range is [4.3,7.9])
## for each interval of 'Sepal.Length', the number of samples from each category of 'Species' is shown
## i.e. 39 of the 50 samples of Setosa have Sepal.Length is in the range (4.3,5.2], and so on.
## the number of intervals (4 in this case) can be customized (see documentation)
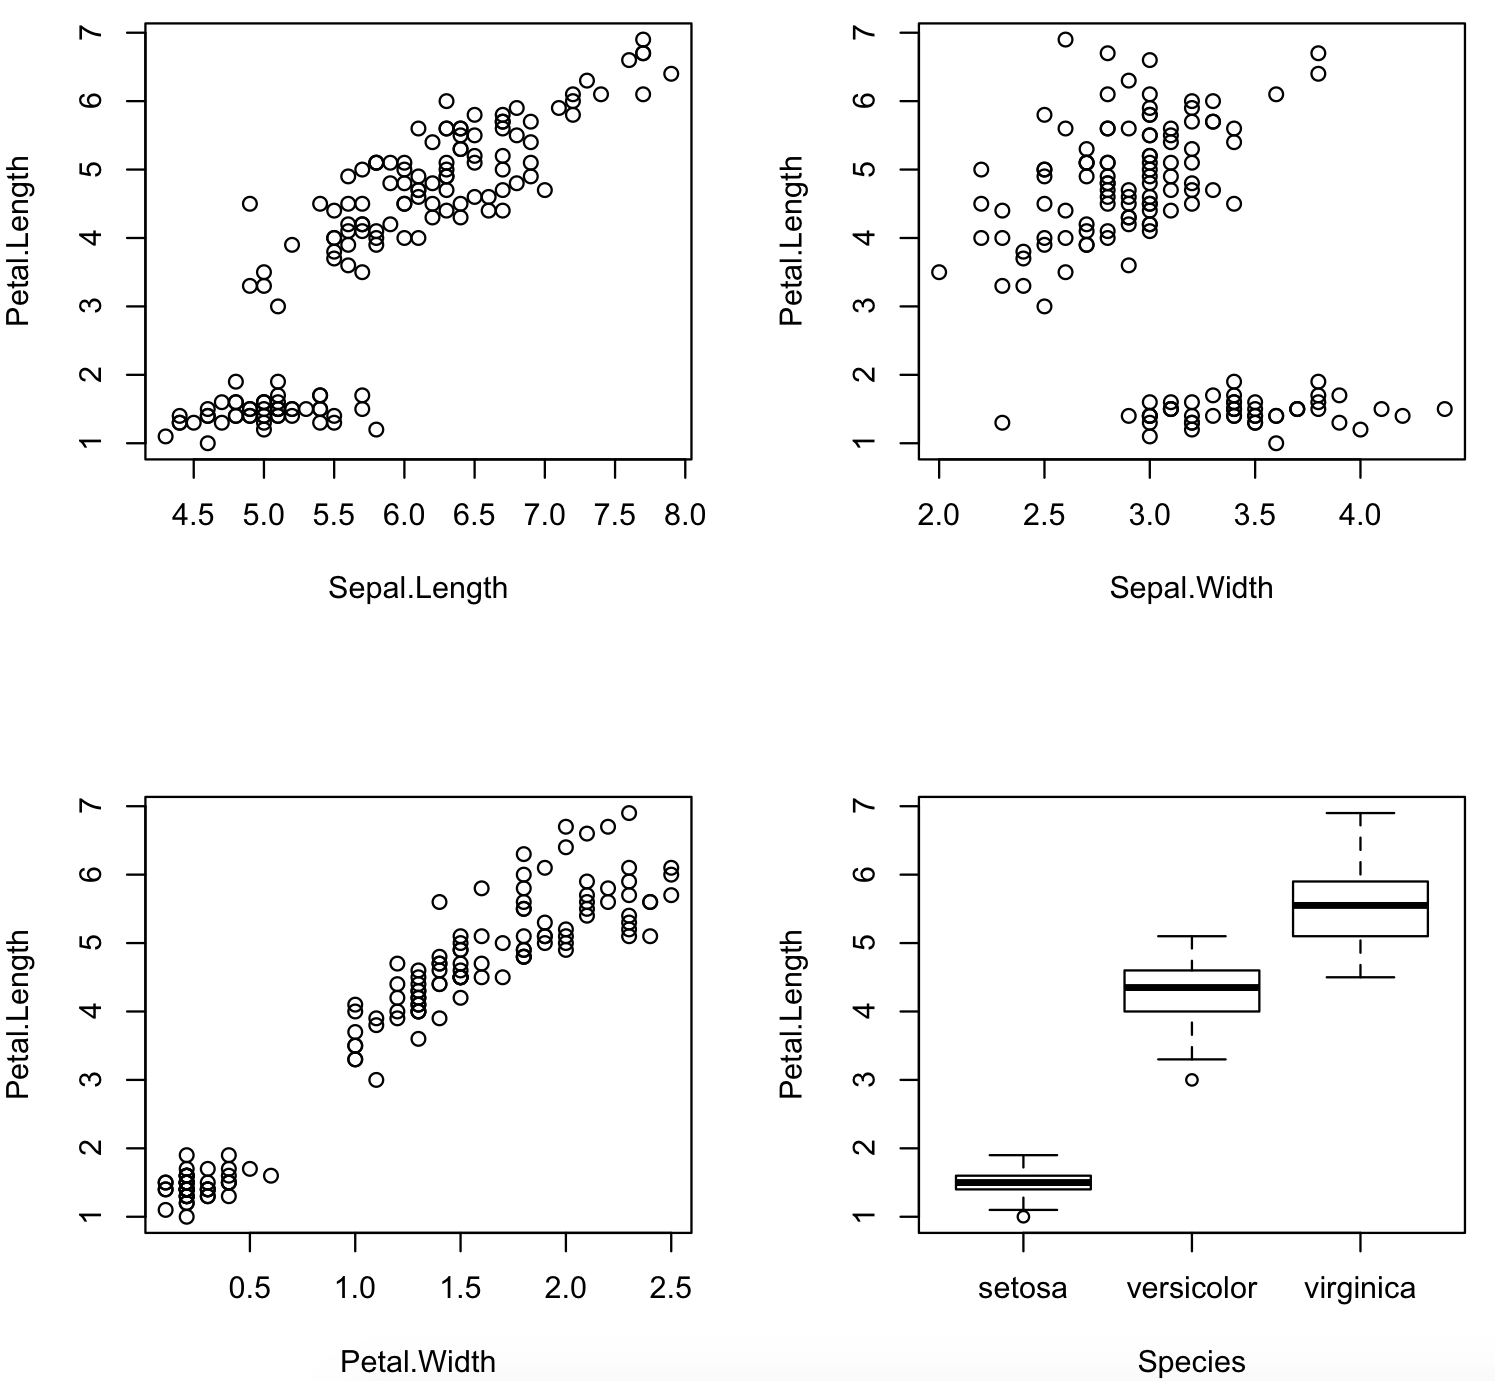
## to plot all other variables against the 'Petal.Length' variable in the iris dataset

Plot(iris,'Petal.Length')

## some interesting patterns can be seen in the plots below and these insights can be used for predictive modeling
ujjwalkarn/xda thuộc nhóm Data trên TopGit, cùng 4 topic GitHub. Trang Trending và Topics liệt kê các repo cùng số sao và cùng ngôn ngữ để so sánh.
Đọc thêm về ujjwalkarn/xda ở đâu?
Trang TopGit này là một snapshot — tab "Readme" hiển thị nguyên văn README của repo (đã bỏ link, giữ ảnh). Repo GitHub ở github.com/ujjwalkarn/xda là nguồn chính thức.
ujjwalkarn/xda có bao nhiêu sao?
ujjwalkarn/xda có 118 sao GitHub — tải lại trang để xem số mới nhất, hoặc xem trực tiếp github.com/ujjwalkarn/xda. TopGit phản chiếu số sao của GitHub nhưng không cam kết đến từng phút.
ujjwalkarn/xda có những chủ đề gì?
GitHub topics của ujjwalkarn/xda: "data-analysis", "data-science", "exploratory-data-analysis", "r". TopGit xếp repo vào nhóm Data.
ujjwalkarn/xda còn đang phát triển không?
Commit gần nhất trên ujjwalkarn/xda là 8.8 năm trước (theo timestamp GitHub). Repo có 47 fork — một chỉ báo về mức độ quan tâm của cộng đồng.
ujjwalkarn/xda viết bằng ngôn ngữ gì?
ujjwalkarn/xda chủ yếu viết bằng R. Trường "language" của GitHub dựa trên phần lớn byte ở nhánh mặc định.
Vì sao ujjwalkarn/xda được xếp vào nhóm Data?
TopGit xếp ujjwalkarn/xda vào nhóm Data dựa trên GitHub topics và mô tả của repo (gắn thẻ: "data-analysis", "data-science", "exploratory-data-analysis"). Việc phân loại dựa trên metadata thật của repo, không phải đoán theo cảm tính biên tập.
Đọc đầy đủ README ở tab phía trên.
Vẫn đang phân vân về xda?
Một cú bấm sẽ gửi câu hỏi kèm trang này cho AI — xem AI nói gì về xda.

 /xda