TopGit tracks brendangregg/FlameGraph on GitHub. The project has 19.7k stars. Stack trace visualizer
Snapshot summary built from the project's own GitHub metadata — there's no written TopGit review yet. The page will update automatically when a full review is published.
WHY NO REVIEW YET
TopGit writes full reviews for the most-starred, most-requested repositories. This page is a snapshot until then — see the READ ME tab for the original README in full.
Main Website: http://www.brendangregg.com/flamegraphs.html
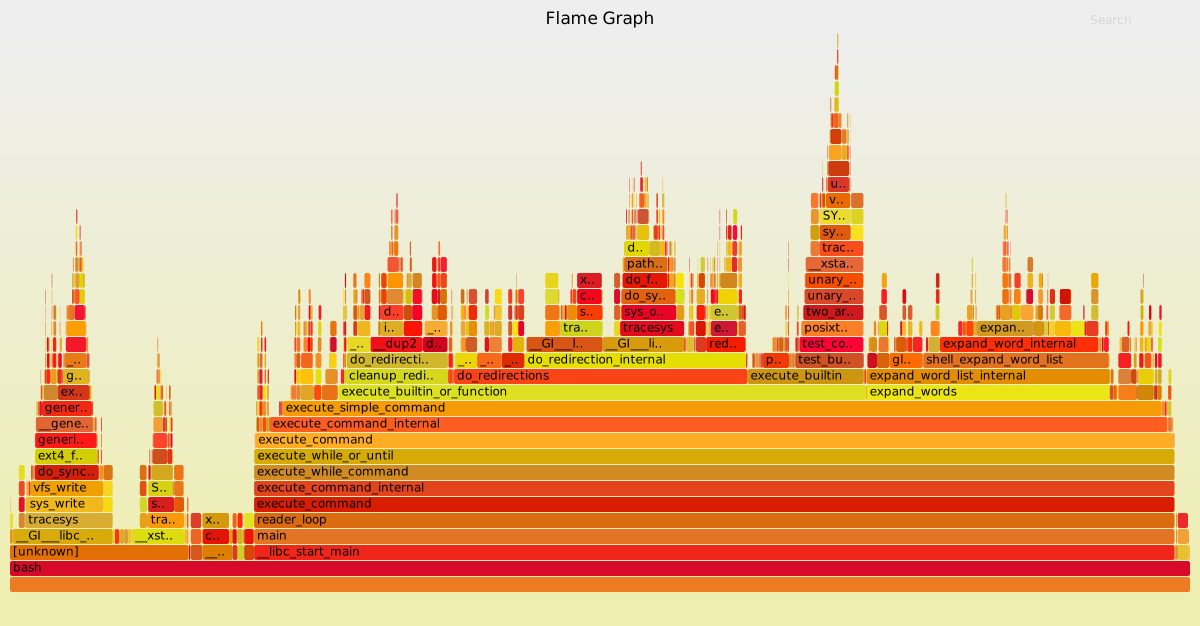
Example (click to zoom):
Click a box to zoom the Flame Graph to this stack frame only.
To search and highlight all stack frames matching a regular expression, click the search button in the upper right corner or press Ctrl-F.
By default, search is case sensitive, but this can be toggled by pressing Ctrl-I or by clicking the ic button in the upper right corner.
Other sites:
The Flame Graph article in ACMQ and CACM: http://queue.acm.org/detail.cfm?id=2927301 http://cacm.acm.org/magazines/2016/6/202665-the-flame-graph/abstract
CPU profiling using Linux perf_events, DTrace, SystemTap, or ktap: http://www.brendangregg.com/FlameGraphs/cpuflamegraphs.html
CPU profiling using XCode Instruments: http://schani.wordpress.com/2012/11/16/flame-graphs-for-instruments/
CPU profiling using Xperf.exe: http://randomascii.wordpress.com/2013/03/26/summarizing-xperf-cpu-usage-with-flame-graphs/
Other examples, updates, and news: http://www.brendangregg.com/flamegraphs.html#Updates
Flame graphs can be created in three steps:
Capture stacks
Fold stacks
flamegraph.pl
1. Capture stacks
Stack samples can be captured using Linux perf_events, FreeBSD pmcstat (hwpmc), DTrace, SystemTap, and many other profilers. See the stackcollapse-* converters.
Linux perf_events
Using Linux perf_events (aka "perf") to capture 60 seconds of 99 Hertz stack samples, both user- and kernel-level stacks, all processes:
# perf record -F 99 -a -g -- sleep 60
# perf script > out.perf
Switch ustack() for jstack() if the application has a ustack helper to include translated frames (eg, node.js frames; see: http://dtrace.org/blogs/dap/2012/01/05/where-does-your-node-program-spend-its-time/). The rate for user-level stack collection is deliberately slower than kernel, which is especially important when using jstack() as it performs additional work to translate frames.
2. Fold stacks
Use the stackcollapse programs to fold stack samples into single lines. The programs provided are:
stackcollapse.pl: for DTrace stacks
stackcollapse-perf.pl: for Linux perf_events "perf script" output
stackcollapse-pmc.pl: for FreeBSD pmcstat -G stacks
stackcollapse-stap.pl: for SystemTap stacks
stackcollapse-instruments.pl: for XCode Instruments
stackcollapse-vtune.pl: for Intel VTune profiles
stackcollapse-ljp.awk: for Lightweight Java Profiler
stackcollapse-jstack.pl: for Java jstack(1) output
stackcollapse-gdb.pl: for gdb(1) stacks
stackcollapse-go.pl: for Golang pprof stacks
stackcollapse-vsprof.pl: for Microsoft Visual Studio profiles
stackcollapse-wcp.pl: for wallClockProfiler output
Usage example:
For perf_events:
$ ./stackcollapse-perf.pl out.perf > out.folded

For DTrace:
$ ./stackcollapse.pl out.kern_stacks > out.kern_folded
This shows my typical workflow: I'll gzip profiles on the target, then copy them to my laptop for analysis. Since I have hundreds of profiles, I leave them gzip'd!
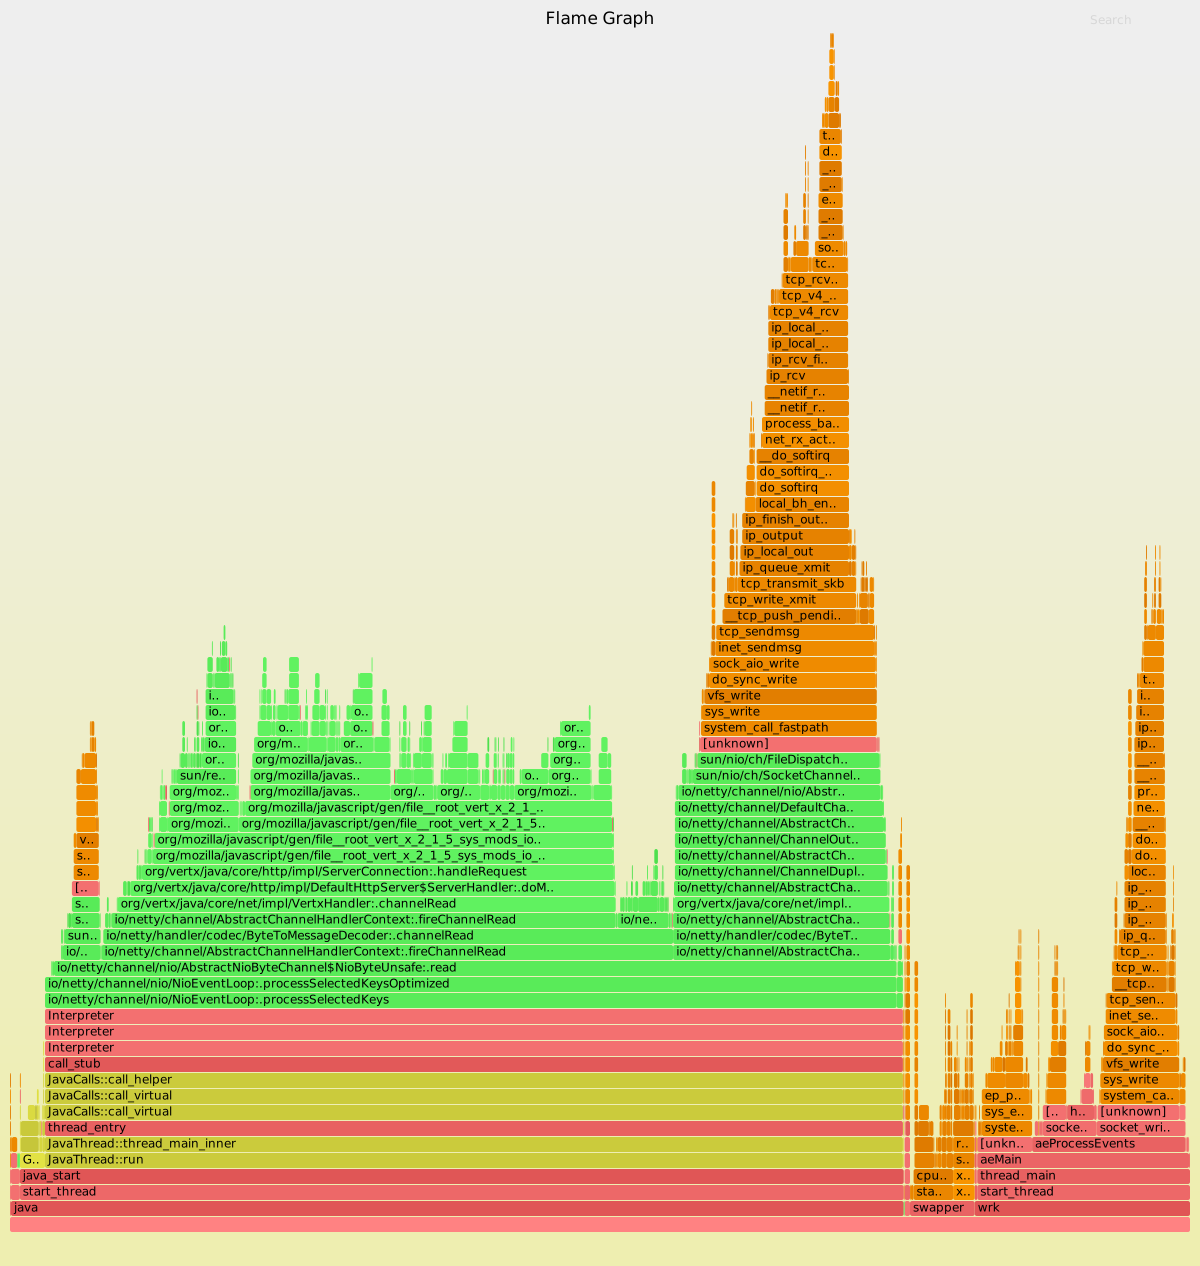
Since this profile included Java, I used the flamegraph.pl --color=java palette. I've also used stackcollapse-perf.pl --all, which includes all annotations that help flamegraph.pl use separate colors for kernel and user level code. The resulting flame graph uses: green == Java, yellow == C++, red == user-mode native, orange == kernel.
This profile was from an analysis of vert.x performance. The benchmark client, wrk, is also visible in the flame graph.
DTrace
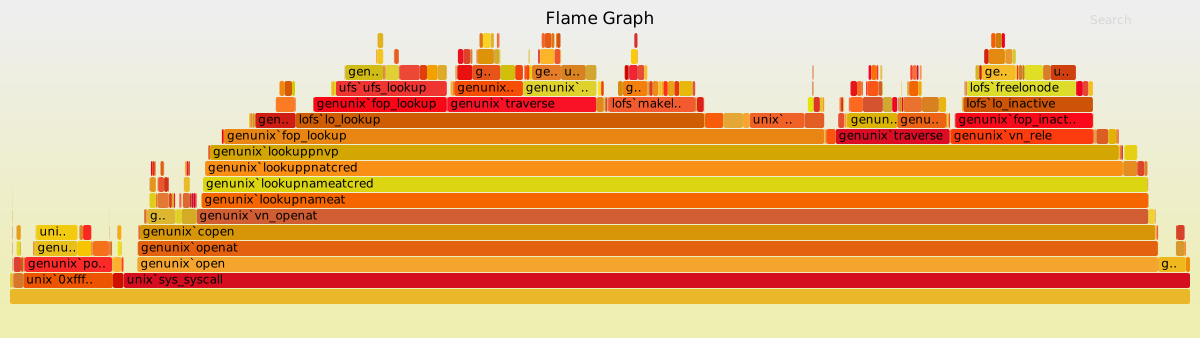
An example output from DTrace is also included, example-dtrace-stacks.txt, and the resulting flame graph, example-dtrace.svg:
--title TEXT     # change title text
--subtitle TEXT  # second level title (optional)
--width NUM      # width of image (default 1200)
--height NUM     # height of each frame (default 16)
--minwidth NUM   # omit smaller functions. In pixels or use "%" for
                 # percentage of time (default 0.1 pixels)
--fonttype FONT  # font type (default "Verdana")
--fontsize NUM   # font size (default 12)
--countname TEXT # count type label (default "samples")
--nametype TEXT  # name type label (default "Function:")
--colors PALETTE # set color palette. choices are: hot (default), mem,
                 # io, wakeup, chain, java, js, perl, red, green, blue,
                 # aqua, yellow, purple, orange
--bgcolors COLOR # set background colors. gradient choices are yellow
                 # (default), blue, green, grey; flat colors use "#rrggbb"
--hash           # colors are keyed by function name hash
--cp             # use consistent palette (palette.map)
--reverse        # generate stack-reversed flame graph
--inverted       # icicle graph
--flamechart     # produce a flame chart (sort by time, do not merge stacks)
--negate         # switch differential hues (blue<->red)
--notes TEXT     # add notes comment in SVG (for debugging)
--help           # this message

eg,
./flamegraph.pl --title="Flame Graph: malloc()" trace.txt > graph.svg
As suggested in the example, flame graphs can process traces of any event,
such as malloc()s, provided stack traces are gathered.
Consistent Palette
If you use the --cp option, it will use the $colors selection and randomly
generate the palette like normal. Any future flamegraphs created using the --cp
option will use the same palette map. Any new symbols from future flamegraphs
will have their colors randomly generated using the $colors selection.
If you don't like the palette, just delete the palette.map file.
This allows your to change your colorscheme between flamegraphs to make the
differences REALLY stand out.
Example:
Say we have 2 captures, one with a problem, and one when it was working
(whatever "it" is):
cat working.folded | ./flamegraph.pl --cp > working.svg
# this generates a palette.map, as per the normal random generated look.

cat broken.folded | ./flamegraph.pl --cp --colors mem > broken.svg
# this svg will use the same palette.map for the same events, but a very
# different colorscheme for any new events.
TopGit's metadata for brendangregg/FlameGraph does not record a license. Most public repositories on GitHub ARE open source, but the exact terms vary — verify by opening the LICENSE file directly.
What is brendangregg/FlameGraph?
brendangregg/FlameGraph (brendangregg/FlameGraph) is a Perl project on GitHub. From the project's own README: Stack trace visualizer
Where can I see brendangregg/FlameGraph in action?
The project maintains a homepage at http://www.brendangregg.com/flamegraphs.html. The README tab on this page also usually contains screenshots and a quickstart.
Where do I read more about brendangregg/FlameGraph?
This TopGit page is a snapshot — the READ ME tab shows the project's own README content (links stripped, images preserved). The GitHub repository at github.com/brendangregg/FlameGraph is the definitive source.
Read full README in the tab above.
Curious whether FlameGraph is right for you?
Let ChatGPT, Claude, or Perplexity look into it — click below and see what AI actually says about FlameGraph.
 /FlameGraph