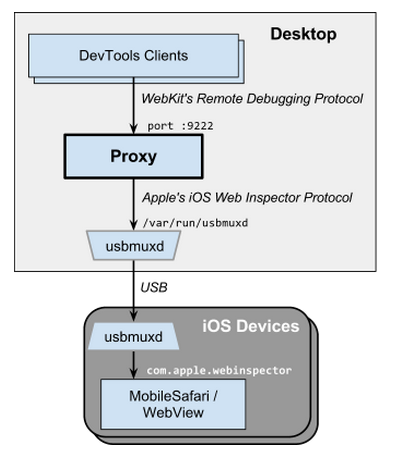
Snapshot of google/ios-webkit-debug-proxy: 6.2k★, C. A DevTools proxy (Chrome Remote Debugging Protocol) for iOS devices (Safari Remote Web Inspector).
Snapshot summary built from the project's own GitHub metadata — there's no written TopGit review yet. The page will update automatically when a full review is published.
WHY NO REVIEW YET
TopGit writes full reviews for the most-starred, most-requested repositories. This page is a snapshot until then — see the READ ME tab for the original README in full.
The ios_webkit_debug_proxy (aka iwdp) proxies requests from usbmuxd daemon over a websocket connection, allowing developers to send commands to MobileSafari and UIWebViews on real and simulated iOS devices.
Installation
iOS WebKit Debug Proxy works on Linux, MacOS & Windows.
git clone https://github.com/google/ios-webkit-debug-proxy.git
cd ios-webkit-debug-proxy

./autogen.sh
make
sudo make install
Usage
On Linux, you must run the usbmuxd daemon. The above install adds a /lib/udev rule to start the daemon whenever a device is attached.
To verify that usbmuxd can list your attached device(s), ensure that libimobiledevice-utils is installed and then run idevice_id -l.
Start the simulator or device
The iOS Simulator is supported, but it must be started before the proxy. The simulator can be started in XCode, standalone, or via the command line:
# Xcode changes these paths frequently, so doublecheck them
SDK_DIR="/Applications/Xcode.app/Contents/Developer/Platforms/iPhoneSimulator.platform/Developer/SDKs"
SIM_APP="/Applications/Xcode.app/Contents/Developer/Applications/Simulator.app/Contents/MacOS/Simulator"
$SIM_APP -SimulateApplication $SDK_DIR/iPhoneSimulator8.4.sdk/Applications/MobileSafari.app/MobileSafari
Enable the inspector
Your attached iOS devices must have ≥1 open browser tabs and the inspector enabled via:
Settings > Safari > Advanced > Web Inspector = ON
Start the proxy
ios_webkit_debug_proxy
--debug for verbose output.
--frontend to specify a frontend
--help for more options.
Ctrl-C to quit. Also, the proxy can be left running as a background process.
Using with DevTools
ios_webkit_debug_proxy can be used with many tools such as Chrome DevTools and Safari Web Inspector.
Chrome Devtools
In recent versions of Chrome and Safari there're major discrepancies between Chrome Remote Debugging Protocol and Webkit Inspector Protocol, which means that newer versions of Chrome DevTools aren't compatible with Safari.
Safari Web Inspector
You can use Safari Web Inspector extracted from Webkit sources, e.g. artygus/webkit-webinspector or HimbeersaftLP/ios-safari-remote-debug-kit.
Firefox DevTools via Valence
Another option is mozilla/valence which enables Firefox DevTools to be used with iOS.
Configuration
View and inspect debuggable tabs
Navigate to localhost:9221. You'll see a listing of all connected devices.
Click through to view tabs available on each, and click through again to open the DevTools for a tab.
If you use -f chrome-devtools://devtools/bundled/inspector.html, you won't be able to click the links shown in localhost:9222 as Chrome blocks clicking these URLs. However, you can copy/paste them into the address bar.
Just the same, you can apply the appropriate port (9222) and page (2) values below.
The -f value must end in ".html". Due to security reasons, https URLs will not work; use http or force-allow with the URL bar's shield icon. As of Chrome 45, the primary URL changed from devtools.html to inspector.html.
To disable the frontend proxy, use the --no-frontend argument.
Port assigment
The default configuration works well for most developers. The device_id-to-port assignment defaults to:
:9221 for the device list
:9222 for the first iOS device that is attached
:9223 for the second iOS device that is attached
...
:9322 for the max device
If a port is in use then the next available port will be used, up to the range limit.
The port assignment is first-come-first-serve but is preserved if a device is detached and reattached, assuming that the proxy is not restarted, e.g.:
start the proxy
the device list gets :9221
attach A gets :9222
attach B gets :9223
detach A, doesn't affect B's port
attach C gets :9224 (not :9222)
reattach A gets :9222 again (not :9225)
The port assignment rules can be set via the command line with -c. The default is equivalent to:
ios_webkit_debug_proxy -c null:9221,:9222-9322
where "null" represents the device list. The following example restricts the proxy to a single device and port:
undefined reference to symbol 'log10@@GLIBC_2.2.5'
/usr/bin/ld: ios_webkit_debug_proxy-char_buffer.o: undefined reference to symbol 'log10@@GLIBC_2.2.5'
//lib/x86_64-linux-gnu/libm.so.6: error adding symbols: DSO missing from command line
Run this before make: ./configure LIBS="-lm"
error while loading shared libraries: libimobiledevice.so.6
ios_webkit_debug_proxy: error while loading shared libraries: libimobiledevice.so.6: cannot open shared object file: No such file or directory
Run sudo ldconfig
idevice_id not found
The idevice_id executable may be found as part of the libimobiledevice-utils package.
could not start com.apple.webinspector! success
Remove and rebuild libimobiledevice.
Could not connect to lockdownd (or doesn't work with iOS10+)
Could not connect to lockdownd. Exiting.: No such file or directory. Unable to attach inspector ios_webkit_debug_proxy
Check the device for a prompt to trust the connected computer. Choose "Trust" and try again.
Could not connect to lockdownd. Exiting.: Broken pipe. Unable to attach inspector
or
Could not connect to lockdownd, error code -<number>. Exiting.
Make sure you're using latest version of ios-webkit-debug-proxy
Inspectable pages list is empty for iOS >= 12.2
Make sure you're using latest version of ios-webkit-debug-proxy
Can not see Simulator
Make sure you started simulator before the proxy
Check that webinspector switch is enabled (Settings -> Safari -> Advanced -> Web Inspector)
Most likely simulator's web inspector daemon listens on ipv6 interface, check that you have ::1 localhost line in /etc/hosts
Building under Rosetta (OS X)
libimobildevice formulae depends on [email protected], which is key-only and requires the following env paths for the build
Does google/ios-webkit-debug-proxy have a project website?
No homepage URL was recorded for google/ios-webkit-debug-proxy in TopGit's last sync. The README tab above frequently contains screenshots and demo links, or check the repository description on GitHub.
Does google/ios-webkit-debug-proxy have any tags?
TopGit's last sync did not record any GitHub topics for google/ios-webkit-debug-proxy. GitHub topics appear in the right sidebar of a repository page; that's the authoritative place to check.
How active is development on google/ios-webkit-debug-proxy?
The most recent commit recorded on google/ios-webkit-debug-proxy was 9 days ago, based on the GitHub push timestamp. The repository has 480 forks — one of the better signals of community interest.
Is google/ios-webkit-debug-proxy open source?
Yes — google/ios-webkit-debug-proxy ships under the BSD-3-Clause license, which makes its source code freely readable (and, depending on license terms, forkable and reusable). Source: github.com/google/ios-webkit-debug-proxy.
What license does google/ios-webkit-debug-proxy use?
google/ios-webkit-debug-proxy is released under the BSD-3-Clause license. Always verify the LICENSE file directly on GitHub for the authoritative terms — license strings can be edited out of sync with a project's actual stance.
Where do I read more about google/ios-webkit-debug-proxy?
This TopGit page is a snapshot — the READ ME tab shows the project's own README content (links stripped, images preserved). The GitHub repository at github.com/google/ios-webkit-debug-proxy is the definitive source.
Read full README in the tab above.
Want a second opinion on ios-webkit-debug-proxy?
Ask an AI that can read this page — one click and you get its take on ios-webkit-debug-proxy.
 /ios-webkit-debug-proxy