johnno1962/SwiftTrace is a Swift project with 749 stars. Trace Swift and Objective-C method invocations
Snapshot summary built from the project's own GitHub metadata — there's no written TopGit review yet. The page will update automatically when a full review is published.
WHY NO REVIEW YET
TopGit writes full reviews for the most-starred, most-requested repositories. This page is a snapshot until then — see the READ ME tab for the original README in full.
Trace Swift and Objective-C method invocations of non-final classes in an app bundle or framework.
Think Xtrace but for Swift and Objective-C. You can also
add "aspects" to member functions of non-final Swift classes to have a closure called before or after
a function implementation executes which in turn can modify incoming arguments or the return value!
Apart from the logging functionality, with binary distribution of Swift frameworks on the horizon perhaps
this will be of use in the same way "Swizzling" was in days of yore.
TL;DR consult the file InjectionNext.swift for some examples of the various ways this package can be used to trace methods and functions.
Note: none of these features will work on a class or method that is final or internal in
a module compiled with whole module optimisation as the dispatch of the method
will be "direct" i.e. linked to a symbol at the call site rather than going through the
class' vtable. As such it is possible to trace calls to methods of a struct but only
if they are referenced through a protocol as they use a witness table which
can be patched.
SwiftTrace can be used with the Swift Package Manager or as a CocoaPod by
adding the following to your project's Podfile:
pod 'SwiftTrace'
Once the project has rebuilt, import SwiftTrace into the application's AppDelegate and add something like the following to the beginning of
it's didFinishLaunchingWithOptions method:
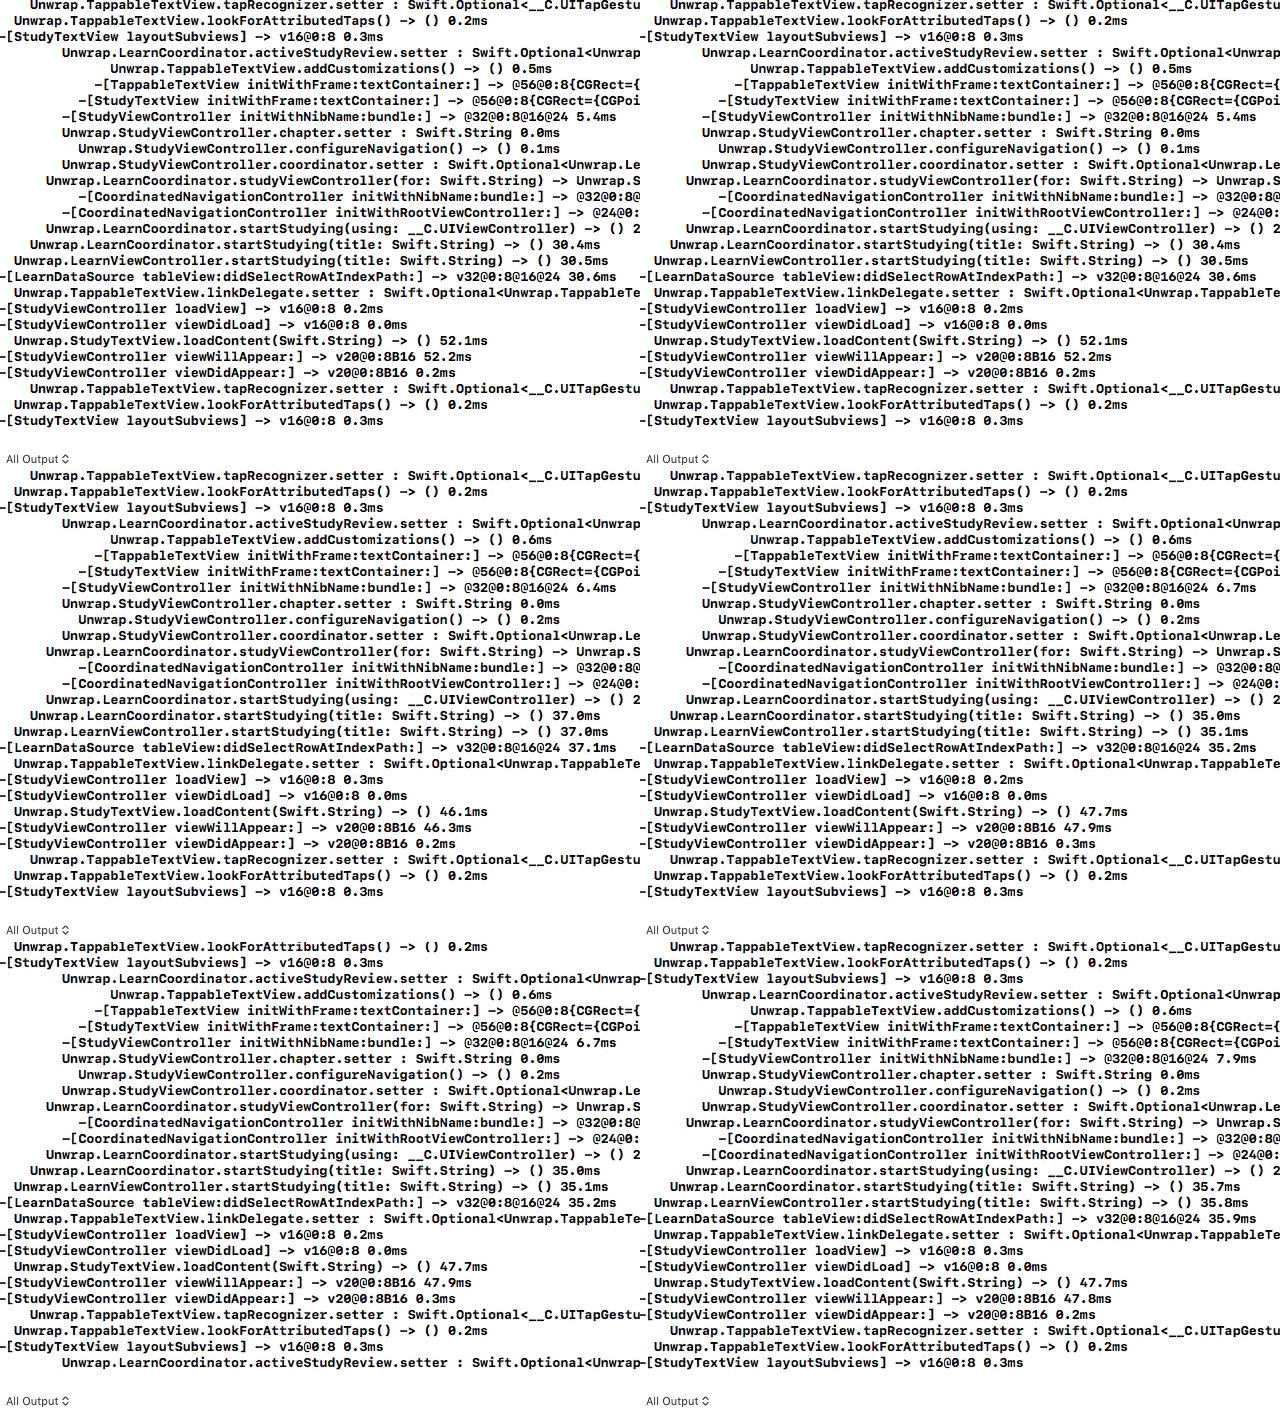
This gives output in the Xcode debug console such as that above.
To trace a system framework such as UIKit you can trace classes using a pattern:
SwiftTrace.traceClasses(matchingPattern:"^UI")
Individual classes can be traced using the underlying api:
SwiftTrace.trace(aClass: MyClass.self)
Or to trace all methods of instances of a particular class including those of their superclasses
use the following:
SwiftTrace.traceInstances(ofClass: aClass)
Or to trace only a particular instance use the following:
SwiftTrace.trace(anInstance: anObject)
If you have specified "-Xlinker -interposable" in your project's "Other Linker Flags"
it's possible to trace all methods in the application's main bundle at once which can be
useful for profiling SwiftUI using the following call:
SwiftTrace.traceMainBundleMethods()
It is possible to trace methods of a structs or other types if they are messaged through
protools as this would then be indirect via what is called a witness table. Tracing
protocols is available at the bundle level where the bundle being traced is specified
using a class instance. They can be further filtered by an optional regular expression.
For example, the following:
These methods must be called before you start the trace as they are applied during the "Swizzle" phase.
There is a default set of exclusions setup as a result of testing by tracing UIKit.
open class var defaultMethodExclusions: String {
    return """
        \\.getter| (?:retain|_tryRetain|release|_isDeallocating|.cxx_destruct|dealloc|description| debugDescription)]|initWithCoder|\
        ^\\+\\[(?:Reader_Base64|UI(?:NibStringIDTable|NibDecoder|CollectionViewData|WebTouchEventsGestureRecognizer)) |\
        ^.\\[(?:UIView|RemoteCapture) |UIDeviceWhiteColor initWithWhite:alpha:|UIButton _defaultBackgroundImageForType:andState:|\
        UIImage _initWithCompositedSymbolImageLayers:name:alignUsingBaselines:|\
        _UIWindowSceneDeviceOrientationSettingsDiffAction _updateDeviceOrientationWithSettingObserverContext:windowScene:transitionContext:|\
        UIColorEffect colorEffectSaturate:|UIWindow _windowWithContextId:|RxSwift.ScheduledDisposable.dispose| ns(?:li|is)_
        """
}
If you want to further process output you can define your own custom tracing sub class:
As the amount of of data logged can quickly get out of hand you can control what is
logged by combing traces with the optional subLevels parameter to the above functions.
For example, the following puts a trace on all of UIKit but will only log calls to methods
of the target instance and up to three levels of calls those method make:
If this seems arbitrary the rules are reasonably simple. When you add a trace with a
non-zero subLevels parameter all previous traces are inhibited unless they are being
made up to subLevels inside a method in the most recent trace or if they where filtered
anyway by a class or instance (traceInstances(ofClass:) and trace(anInstance:)).
If you would like to extend SwiftTrace to be able to log one of your app's types
there are two steps. First, you may need to extend the type to conform to
SwiftTraceFloatArg if it contains only float only float types for example SwiftUI.EdgeInsets.
Many of these API's are also available as a extension of NSObject which is useful
when SwiftTrace is made available by dynamically loading bundle as in
(InjectionIII)[https://github.com/johnno1962/InjectionIII].
This is useful when SwiftTrace is made available by dynamically loading a bundle
such as when using (InjectionIII)[https://github.com/johnno1962/InjectionIII]. Rather
than having to include a CocoaPod, all you need to do is add SwiftTrace.h in the
InjectionIII application's bundle to your bridging header and dynamically load the bundle.
You can track the allocations an deallocations of Swift and
Objective-C classes using the SwiftTrace.LifetimeTracker class:
SwiftTrace.swizzleFactory = SwiftTrace.LifetimeTracker.self
SwiftTrace.traceMainBundleMethods() == 0 {
    print("⚠️ Tracing Swift methods can only work if you have -Xlinker -interposable to your project's \"Other Linker Flags\"")
}
SwiftTrace.traceMainBundle()
Each time an object is allocated you will see a .__allocating_init message
followed by the result and the resulting count of live objects allocated
since tracing was started. Each time an object is deallocated you will
see a cxx_destruct message followed by the number of objects
oustanding for that class.
If you would like to track the lifecycle of Swift structs, create a marker
class and add a property to the struct initialised to an instance of it.
class Marker<What> {}

struct MyView: SwiftUI.View {
    var marker = Marker<MyView>()
}
This idea is based on the LifetimeTracker
project by Krzysztof Zabłocki.
Aspects
You can add an aspect to a particular method using the method's de-mangled name:
    print(SwiftTrace.addAspect(aClass: TestClass.self,
                      methodName: "SwiftTwaceApp.TestClass.x() -> ()",
                      onEntry: { (_, _) in print("ONE") },
                      onExit: { (_, _) in print("TWO") }))
This will print "ONE" when method "x" of TextClass is called and "TWO when it has exited. The
two arguments are the Swizzle which is an object representing the "Swizzle" and the entry or
exit stack. The full signature for the entry closure is:
onEntry: { (swizzle: SwiftTrace.Swizzle, stack: inout SwiftTrace.EntryStack) in
If you understand how registers are allocated to arguments it is possible to poke into the
stack to modify the incoming arguments and, for the exit aspect closure you can replace
the return value and on a good day log (and prevent) an error being thrown.
Replacing an input argument in the closure is relatively simple:
    stack.intArg1 = 99
    stack.floatArg3 = 77.3
Other types of argument a little more involved. They must be cast and String
takes up two integer registers.
In an exit aspect closure, setting the return type is easier as it is generic:
stack.setReturn(value: "Phew")
When a function throws you can access NSError objects.
print(swizzle.rebind(&stack.thrownError, to: NSError.self).pointee)
It is possible to set stack.thrownError to zero to cancel the throw but you will need to set
the return value.
If this seems complicated there is a property swizzle.arguments which can be used
onEntry which contains the arguments as an Array containing elements of type Any
which can be cast to the expected type. Element 0 is self.
Invocation interface
Now we have a trampoline infrastructure, it is possible to implement an invocation api for Swift:
There are limitations to this abbreviated interface in that it only supports Double, Float,
String, Int, Object, CGRect, CGSize and CGPoint arguments. For other struct types that
do not contain floating point values you can conform them to protocol SwiftTraceArg
to be able to pass them on the argument list or SwiftTraceFloatArg if they contain
only floats. These values and return values must fit into 32 bytes and not contain floats.
How it works
A Swift AnyClass instance has a layout similar to an Objective-C class with some
additional data documented in the ClassMetadataSwift in SwiftMeta.swift. After this data
there is the vtable of pointers to the class and instance member functions of the class up to
the size of the class instance. SwiftTrace replaces these function pointers with a pointer
to a unique assembly language "trampoline" entry point which has destination function and
data pointers associated with it. Registers are saved and this function is called passing
the data pointer to log the method name. The method name is determined by de-mangling the
symbol name associated the function address of the implementing method. The registers are
then restored and control is passed to the original function implementing the method.
Please file an issue if you encounter a project that doesn't work while tracing. It should
be far more reliable as it uses assembly language trampolines rather than Swizzling like
Xtrace did. Otherwise, the author can be contacted on Twitter @Injection4Xcode.
Thanks to Oliver Letterer for the imp_implementationForwardingToSelector project adapted to set up the
trampolines, included under an MIT license.
The repo includes a very slightly modified version of the very handy
https://github.com/facebook/fishhook.
See the source and header files for their licensing details.
Thanks also to @twostraws'
Unwrap and @artsy's
eidolon used extensively during testing.
How active is development on johnno1962/SwiftTrace?
The most recent commit recorded on johnno1962/SwiftTrace was 2 months ago, based on the GitHub push timestamp. The repository has 54 forks — one of the better signals of community interest.
How many stars does johnno1962/SwiftTrace have?
johnno1962/SwiftTrace has 749 GitHub stars — refresh the page for the live number, or check github.com/johnno1962/SwiftTrace. TopGit mirrors GitHub's count but does not claim minute-by-minute accuracy.
Is johnno1962/SwiftTrace open source?
TopGit's metadata for johnno1962/SwiftTrace does not record a license. Most public repositories on GitHub ARE open source, but the exact terms vary — verify by opening the LICENSE file directly.
What is johnno1962/SwiftTrace?
johnno1962/SwiftTrace (johnno1962/SwiftTrace) is a Swift project on GitHub. From the project's own README: Trace Swift and Objective-C method invocations
What language is johnno1962/SwiftTrace written in?
johnno1962/SwiftTrace is written primarily in Swift. GitHub's language field is based on the largest share of bytes in the default branch.
Where do I read more about johnno1962/SwiftTrace?
This TopGit page is a snapshot — the READ ME tab shows the project's own README content (links stripped, images preserved). The GitHub repository at github.com/johnno1962/SwiftTrace is the definitive source.
Read full README in the tab above.
Is SwiftTrace worth your time?
ChatGPT, Claude and Perplexity can all read this page. Ask one of them what it makes of SwiftTrace.
 /SwiftTrace