leandromoreira/linux-network-performance-parameters is tracked by TopGit as an open-source project, with 5.8k stars on GitHub. Learn where some of the network sysctl variables fit into the Linux/Kernel network flow. Translations: 🇷🇺
Snapshot summary built from the project's own GitHub metadata — there's no written TopGit review yet. The page will update automatically when a full review is published.
WHY NO REVIEW YET
TopGit writes full reviews for the most-starred, most-requested repositories. This page is a snapshot until then — see the READ ME tab for the original README in full.
Honorable mentions - TCP FSM and congestion algorithm
Network tools
References
Introduction
Sometimes people are looking for sysctl cargo cult values that bring high throughput and low latency with no trade-offs and work in every situation. That's not realistic, although we can say that the newer kernel versions are very well tuned by default. In fact, you might hurt performance if you mess with the defaults.
This brief tutorial shows where some of the most used and quoted sysctl/network parameters are located into the Linux network flow, it was heavily inspired by the illustrated guide to the Linux networking stack and many of Marek Majkowski's posts.
Feel free to send corrections and suggestions! :)
Linux network packets flow to memory overview
Fitting the sysctl variables into the Linux network flow
Ingress - they're coming
Packets arrive at the NIC
NIC will verify MAC (if not on promiscuous mode) and FCS and decide to drop or to continue
NIC will DMA packets to RAM, in a region previously prepared (mapped) by the driver
NIC will enqueue references to the packets at receive ring buffer queue rx until rx-usecs timeout or rx-frames
NIC will raise a hard IRQ
CPU will run the IRQ handler that runs the driver's code
The driver will schedule NAPI, clear the hard IRQ, and return
The driver raises a soft IRQ (NET_RX_SOFTIRQ)
NAPI will poll data from the receive ring buffer until netdev_budget_usecs timeout or netdev_budget and dev_weight packets
Linux will also allocate memory to sk_buff
Linux fills the metadata: protocol, interface, setmacheader, removes ethernet
Linux will pass the skb to the kernel stack (netif_receive_skb)
It will set the network header, clone skb to taps (i.e. tcpdump) and pass it to tc ingress
Packets are handled to a qdisc sized netdev_max_backlog with its algorithm defined by default_qdisc
It calls ip_rcv and packets are handed to IP
It calls netfilter (PREROUTING)
It looks at the routing table, if forwarding or local
If it's local it calls netfilter (LOCAL_IN)
It calls the L4 protocol (for instance tcp_v4_rcv)
It finds the right socket
It goes to the tcp finite state machine
Enqueue the packet to the receive buffer and sized as tcp_rmem rules
If tcp_moderate_rcvbuf is enabled, the kernel will auto-tune the receive buffer
Kernel will signalize that there is data available to apps (epoll or any polling system)
Application wakes up and reads the data
Egress - they're leaving
Application sends message (sendmsg or other)
TCP send message allocates skb_buff
It enqueues skb to the socket write buffer of tcp_wmem size
Builds the TCP header (src and dst port, checksum)
Calls L3 handler (in this case ipv4 on tcp_write_xmit and tcp_transmit_skb)
L3 (ip_queue_xmit) does its work: build ip header and call netfilter (LOCAL_OUT)
Calls output route action
Calls netfilter (POST_ROUTING)
Fragment the packet (ip_output)
Calls L2 send function (dev_queue_xmit)
Feeds the output (QDisc) queue of txqueuelen length using its default_qdisc algorithm.
The driver code enqueue the packets at the ring buffer tx
The driver will do a soft IRQ (NET_TX_SOFTIRQ) after tx-usecs timeout or tx-frames
Re-enable hard IRQ to NIC
Driver will map all the packets (to be sent) to some DMA'ed region
NIC fetches the packets (via DMA) from RAM to transmit
After the transmission NIC will raise a hard IRQ to signal its completion
The driver will handle this IRQ (turn it off)
And schedule (soft IRQ) the NAPI poll system
NAPI will handle the receive packets signaling and free the RAM
How to check - perf
If you want to see the network tracing within Linux you can use perf.
docker run -it --rm --cap-add SYS_ADMIN --entrypoint bash ljishen/perf
apt-get update
apt-get install iputils-ping

# this is going to trace all events (not syscalls) to the subsystem net:* while performing the ping
perf trace --no-syscalls --event 'net:*' ping globo.com -c1 > /dev/null
What, Why and How - network and sysctl parameters
Ring Buffer - rx,tx
What - the driver receive/send queue a single or multiple queues with a fixed size, usually implemented as FIFO, it is located at RAM
Why - buffer to smoothly accept bursts of connections without dropping them, you might need to increase these queues when you see drops or overrun, aka there are more packets coming than the kernel is able to consume them, the side effect might be increased latency.
What - number of microseconds/frames to wait before raising a hardIRQ, from the NIC perspective it'll DMA data packets until this timeout/number of frames
Why - reduce CPUs usage, hard IRQ, might increase throughput at cost of latency.
How:
Check command:ethtool -c ethX
Change command:ethtool -C ethX rx-usecs value tx-usecs value
How to monitor:cat /proc/interrupts
Interrupt Coalescing (soft IRQ) and Ingress QDisc
What - maximum number of microseconds in one NAPI polling cycle. Polling will exit when either netdev_budget_usecs have elapsed during the poll cycle or the number of packets processed reaches netdev_budget.
Why - instead of reacting to tons of softIRQ, the driver keeps polling data; keep an eye on dropped (# of packets that were dropped because netdev_max_backlog was exceeded) and squeezed (# of times ksoftirq ran out of netdev_budget or time slice with work remaining).
How:
Check command:sysctl net.core.netdev_budget_usecs
Change command:sysctl -w net.core.netdev_budget_usecs value
How to monitor:cat /proc/net/softnet_stat; or a better tool
What - netdev_budget is the maximum number of packets taken from all interfaces in one polling cycle (NAPI poll). In one polling cycle interfaces which are registered to polling are probed in a round-robin manner. Also, a polling cycle may not exceed netdev_budget_usecs microseconds, even if netdev_budget has not been exhausted.
How:
Check command:sysctl net.core.netdev_budget
Change command:sysctl -w net.core.netdev_budget value
How to monitor:cat /proc/net/softnet_stat; or a better tool
What - dev_weight is the maximum number of packets that kernel can handle on a NAPI interrupt, it's a Per-CPU variable. For drivers that support LRO or GRO_HW, a hardware aggregated packet is counted as one packet in this.
How:
Check command:sysctl net.core.dev_weight
Change command:sysctl -w net.core.dev_weight value
How to monitor:cat /proc/net/softnet_stat; or a better tool
What - netdev_max_backlog is the maximum number of packets, queued on the INPUT side (the ingress qdisc), when the interface receives packets faster than kernel can process them.
How:
Check command:sysctl net.core.netdev_max_backlog
Change command:sysctl -w net.core.netdev_max_backlog value
How to monitor:cat /proc/net/softnet_stat; or a better tool
Egress QDisc - txqueuelen and default_qdisc
What - txqueuelen is the maximum number of packets, queued on the OUTPUT side.
Why - a buffer/queue to face connection burst and also to apply tc (traffic control).
How:
Check command:ip link show dev ethX
Change command:ip link set dev ethX txqueuelen N
How to monitor:ip -s link
What - default_qdisc is the default queuing discipline to use for network devices.
Why - each application has different load and need to traffic control and it is used also to fight against bufferbloat
How:
Check command:sysctl net.core.default_qdisc
Change command:sysctl -w net.core.default_qdisc value
How to monitor:tc -s qdisc ls dev ethX
TCP Read and Write Buffers/Queues
The policy that defines what is memory pressure is specified at tcp_mem and tcp_moderate_rcvbuf.
What - tcp_rmem - min (size used under memory pressure), default (initial size), max (maximum size) - size of receive buffer used by TCP sockets.
Why - the application buffer/queue to the write/send data, understand its consequences can help a lot.
How:
Check command:sysctl net.ipv4.tcp_rmem
Change command:sysctl -w net.ipv4.tcp_rmem="min default max"; when changing default value, remember to restart your user space app (i.e. your web server, nginx, etc)
How to monitor:cat /proc/net/sockstat
What - tcp_wmem - min (size used under memory pressure), default (initial size), max (maximum size) - size of send buffer used by TCP sockets.
How:
Check command:sysctl net.ipv4.tcp_wmem
Change command:sysctl -w net.ipv4.tcp_wmem="min default max"; when changing default value, remember to restart your user space app (i.e. your web server, nginx, etc)
How to monitor:cat /proc/net/sockstat
Whattcp_moderate_rcvbuf - If set, TCP performs receive buffer auto-tuning, attempting to automatically size the buffer.
How:
Check command:sysctl net.ipv4.tcp_moderate_rcvbuf
Change command:sysctl -w net.ipv4.tcp_moderate_rcvbuf value
How to monitor:cat /proc/net/sockstat
Honorable mentions - TCP FSM and congestion algorithm
Accept and SYN Queues are governed by net.core.somaxconn and net.ipv4.tcp_max_syn_backlog. Nowadays net.core.somaxconn caps both queue sizes.
sysctl net.core.somaxconn - provides an upper limit on the value of the backlog parameter passed to the listen() function, known in userspace as SOMAXCONN. If you change this value, you should also change your application to a compatible value (i.e. nginx backlog).
cat /proc/sys/net/ipv4/tcp_fin_timeout - this specifies the number of seconds to wait for a final FIN packet before the socket is forcibly closed. This is strictly a violation of the TCP specification but required to prevent denial-of-service attacks.
cat /proc/sys/net/ipv4/tcp_available_congestion_control - shows the available congestion control choices that are registered.
cat /proc/sys/net/ipv4/tcp_congestion_control - sets the congestion control algorithm to be used for new connections.
cat /proc/sys/net/ipv4/tcp_max_syn_backlog - sets the maximum number of queued connection requests which have still not received an acknowledgment from the connecting client; if this number is exceeded, the kernel will begin dropping requests.
cat /proc/sys/net/ipv4/tcp_syncookies - enables/disables syn cookies, useful for protecting against syn flood attacks.
netstat -atn | awk '/tcp/ {print $6}' | sort | uniq -c - summary by state
ss -neopt state time-wait | wc -l - counters by a specific state: established, syn-sent, syn-recv, fin-wait-1, fin-wait-2, time-wait, closed, close-wait, last-ack, listening, closing
netstat -st - tcp stats summary
nstat -a - human-friendly tcp stats summary
cat /proc/net/sockstat - summarized socket stats
cat /proc/net/tcp - detailed stats, see each field meaning at the kernel docs
cat /proc/net/netstat - ListenOverflows and ListenDrops are important fields to keep an eye on
How many stars does leandromoreira/linux-network-performance-parameters have?
leandromoreira/linux-network-performance-parameters has 5.8k GitHub stars — refresh the page for the live number, or check github.com/leandromoreira/linux-network-performance-parameters. TopGit mirrors GitHub's count but does not claim minute-by-minute accuracy.
Is leandromoreira/linux-network-performance-parameters open source?
Yes — leandromoreira/linux-network-performance-parameters ships under the BSD-3-Clause license, which makes its source code freely readable (and, depending on license terms, forkable and reusable). Source: github.com/leandromoreira/linux-network-performance-parameters.
What is leandromoreira/linux-network-performance-parameters?
leandromoreira/linux-network-performance-parameters (leandromoreira/linux-network-performance-parameters) is a multi-language project on GitHub. From the project's own README: Learn where some of the network sysctl variables fit into the Linux/Kernel network flow. Translations: 🇷🇺
Where can I see leandromoreira/linux-network-performance-parameters in action?
The project maintains a homepage at https://github.com/leandromoreira/linux-network-performance-parameters. The README tab on this page also usually contains screenshots and a quickstart.
Where do I read more about leandromoreira/linux-network-performance-parameters?
This TopGit page is a snapshot — the READ ME tab shows the project's own README content (links stripped, images preserved). The GitHub repository at github.com/leandromoreira/linux-network-performance-parameters is the definitive source.
Read full README in the tab above.
Want a second opinion on linux-network-performance-parameters?
Ask an AI that can read this page — one click and you get its take on linux-network-performance-parameters.
 /linux-network-performance-parameters
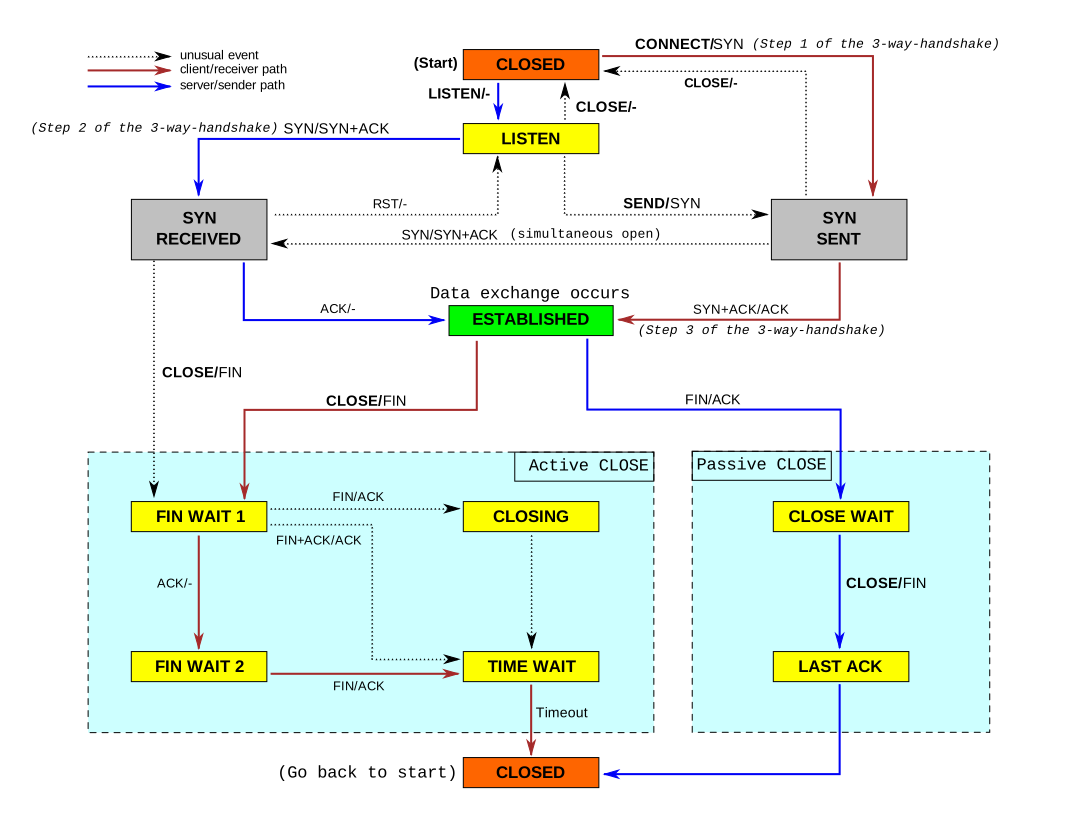 Source: https://commons.wikimedia.org/wiki/File:Tcp_state_diagram_fixed_new.svg