ohmyzsh/trace.ohmyz.sh is an open-source project on GitHub with 5 stars, written primarily in TypeScript. 🔬 A fast, interactive web-based viewer for performance tracing of zsh, with all heavy lifting done thanks to speedscope.app 💪
Snapshot summary built from the project's own GitHub metadata — there's no written TopGit review yet. The page will update automatically when a full review is published.
WHY NO REVIEW YET
TopGit writes full reviews for the most-starred, most-requested repositories. This page is a snapshot until then — see the READ ME tab for the original README in full.
This is a fork from speedscope.app that has a converter from custom zsh trace format to flamegraph, allowing you to visualize where time is spent.
[!NOTE]
This is a very early stage experimental project. The tracing adds a lot of overhead, mostly spent on serializing and writing verbose traces to the log file.
This means you'll measure significantly higher startup times, but the time spent and shown in the graph should be proportionally the same as without tracing enabled.
Set up
Create a directory where to store trace files.
Add the custom zsh trace script in the .zshenv startup phase:
If you have a .zshenv, add the lines at the top. Otherwise save it as the .zshenv file in your home directory.
Make sure to change where the trace files are stored.
When the shell starts, it will output the start time and in which file it was stored.
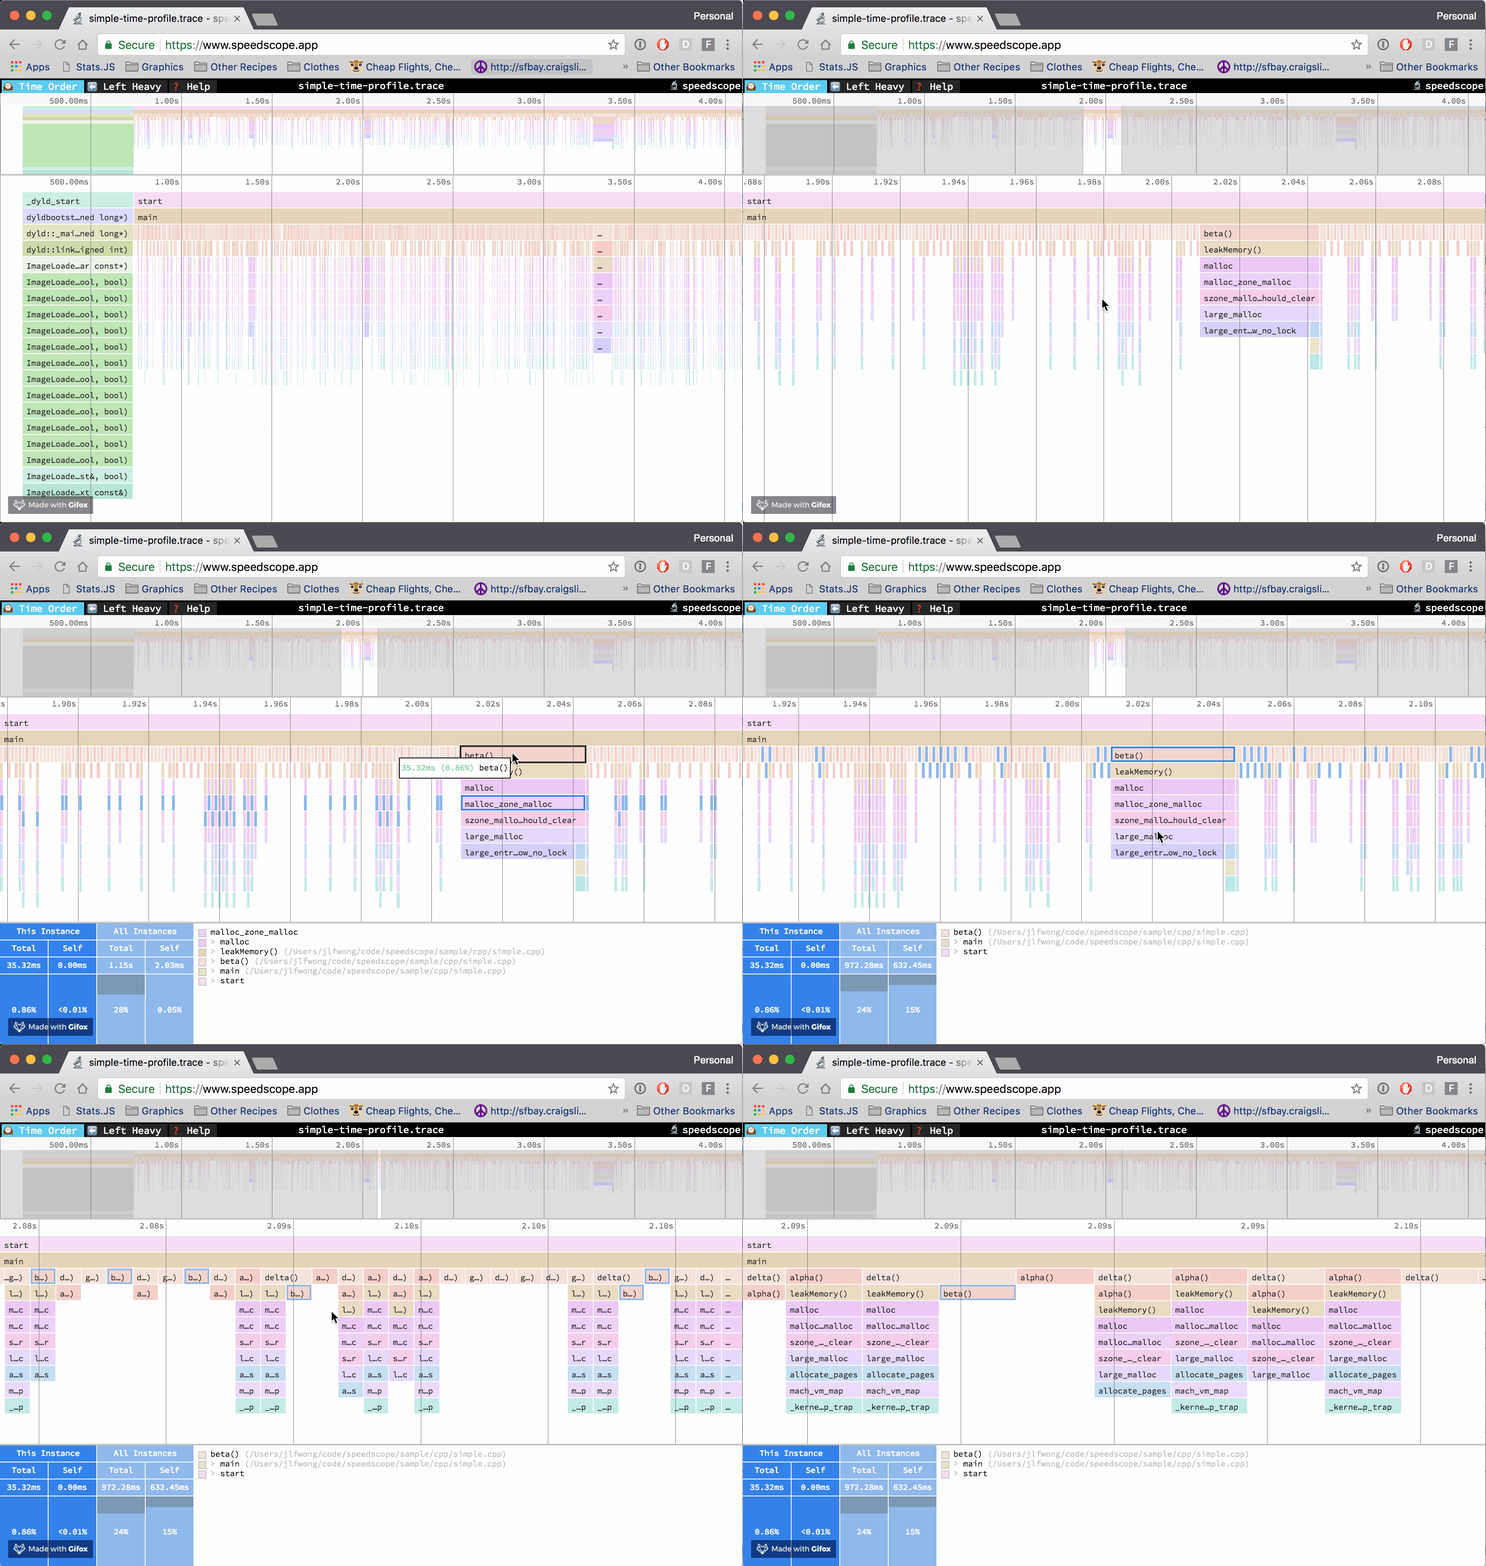
Go to https://trace.ohmyz.sh and drag-and-drop the file to see the flamegraph.
You can click on specific frames to see what code is run.
Screenshots
🔬speedscope README
English | 简体中文
A fast, interactive web-based viewer for performance profiles. Supports import from a variety of profiles in a variety of languages (JS, Ruby, Python, Go & more). Try it here: https://www.speedscope.app
Given raw profiling data, speedscope allows you to interactively explore the data to get insight into what's slow in your application, or allocating all the memory, or whatever data is represented in the profiling data.
Supported file formats
speedscope is designed to ingest profiles from a variety of different profilers for different programming languages & environments. Click the links below for documentation on how to import from a specific source.
JavaScript
Importing from Chrome
Importing from Firefox
Importing from Safari
Importing from Node.js
Importing from Hermes (for React Native)
Ruby
Importing from stackprof
Importing from rbspy
Importing from ruby-prof
Python
Importing from py-spy
pyspeedscope
Importing from Austin
Importing from pyinstrument
PHP
Importing from phpspy or sj-i/php-profiler
Go
Importing from pprof
Rust
flamescope
Java
Importing from async‐profiler (Java)
Erlang/Elixir
eflambe
Native code
Importing from Instruments.app (macOS)
Importing from perf (linux)
Importing from .NET Core
Importing from GHC (Haskell)
Importing from custom sources
Contributions to add support for additional formats are welcome! See issues with the "import source" tag.
Usage
Visit https://www.speedscope.app, then either browse to find a profile file or drag-and-drop one onto the page. The profiles are not uploaded anywhere -- the application is totally in-browser.
Command line usage
For offline use, or convenience in the terminal, you can also install speedscope
via npm:
npm install -g speedscope
Invoking speedscope /path/to/profile will load speedscope in your default browser.
Self-contained directory
If you don't have npm or node installed, you can also download a
self-contained version from https://github.com/jlfwong/speedscope/releases.
After you download the zip file from a release, simply unzip it and open the
contained index.html in Chrome or Firefox.
Importing via URL
To load a specific profile by URL, you can append a hash fragment like #profileURL=[URL-encoded profile URL]&title=[URL-encoded custom title]. Note that the server hosting the profile must have CORS configured to allow AJAX requests from speedscope.
Views
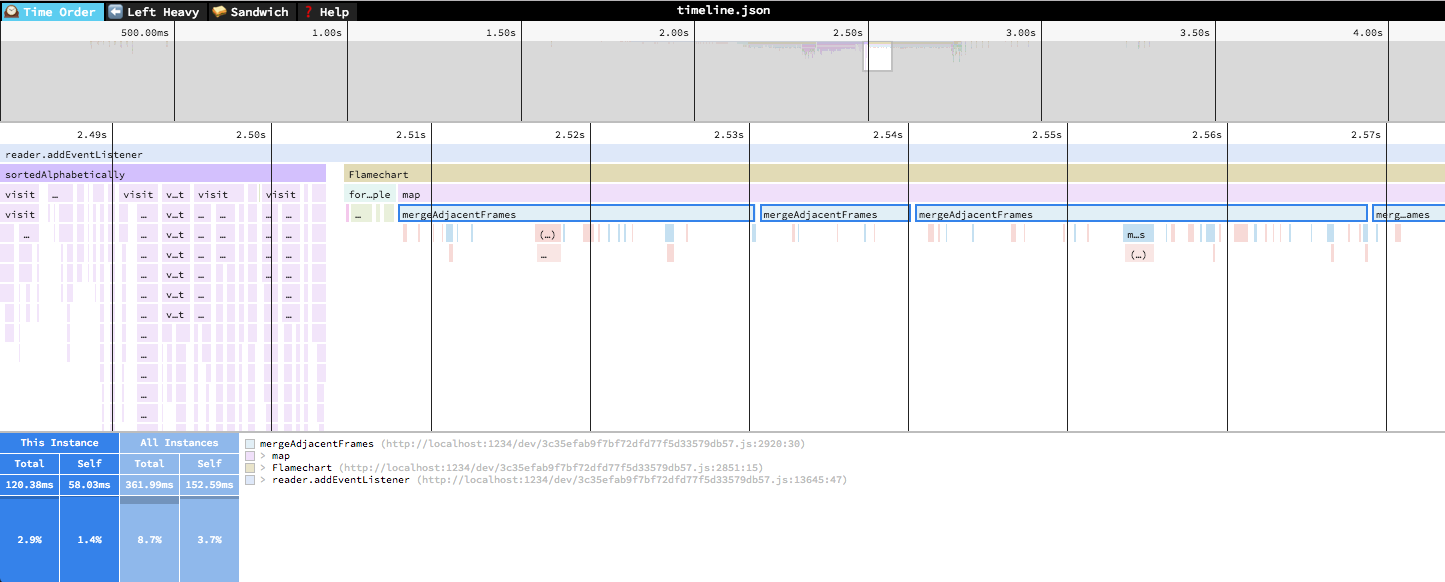
🕰Time Order
In the "Time Order" view (the default), call stacks are ordered left-to-right in the same order as they occurred in the input file, which is usually going to be the chronological order they were recorded in. This view is most helpful for understanding the behavior of an application over time, e.g. "first the data is fetched from the database, then the data is prepared for serialization, then the data is serialized to JSON".
The horizontal axis represents the "weight" of each stack (most commonly CPU time), and the vertical axis shows you the stack active at the time of the sample. If you click on one of the frames, you'll be able to see summary statistics about it.
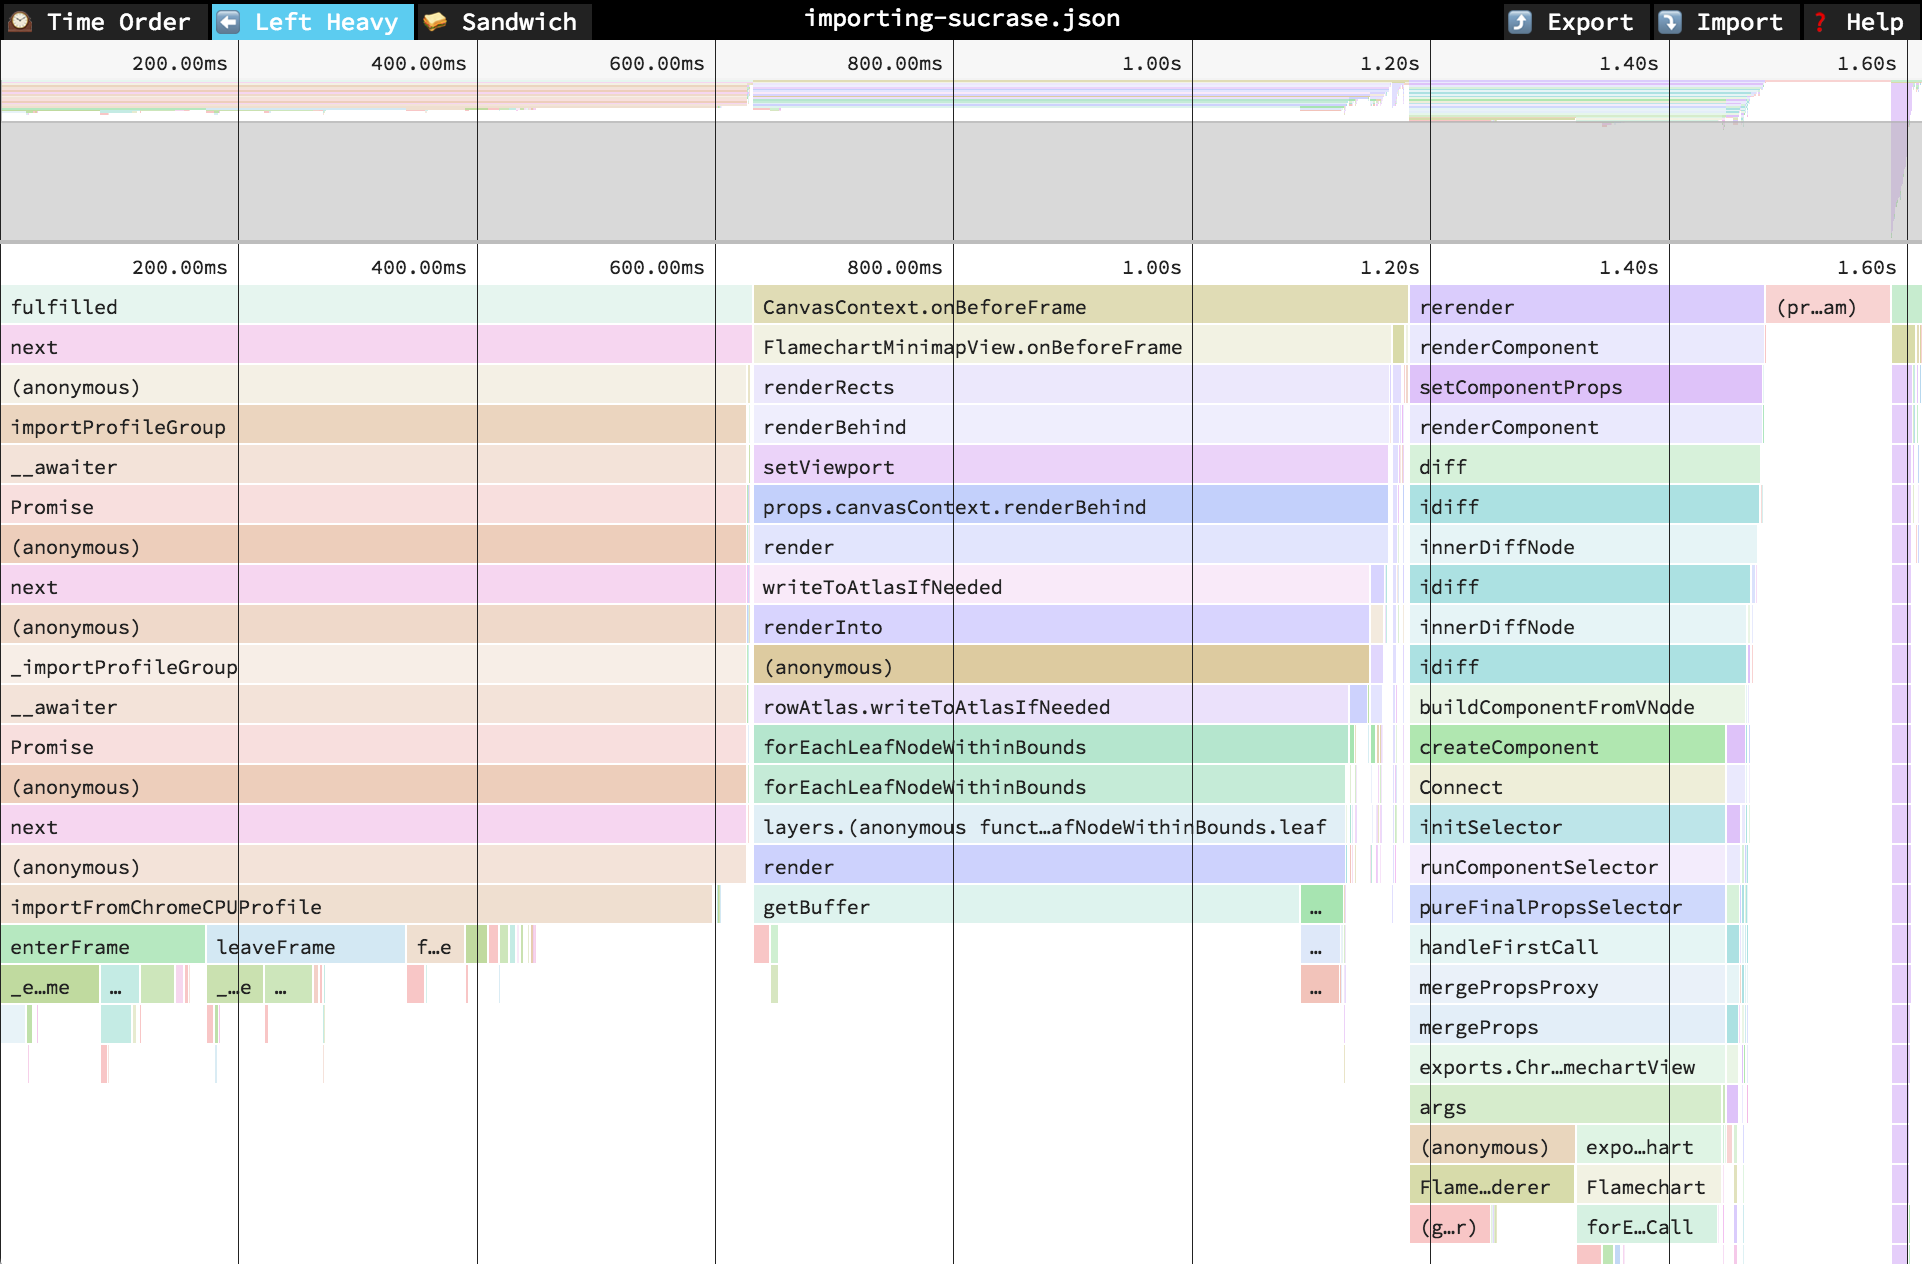
⬅️Left Heavy
In the "Left Heavy" view, identical stacks are grouped together, regardless of whether they were recorded sequentially. Then, the stacks are sorted so that the heaviest stack for each parent is on the left -- hence "left heavy". This view is useful for understanding where all the time is going in situations where there are hundreds or thousands of function calls interleaved between other call stacks.
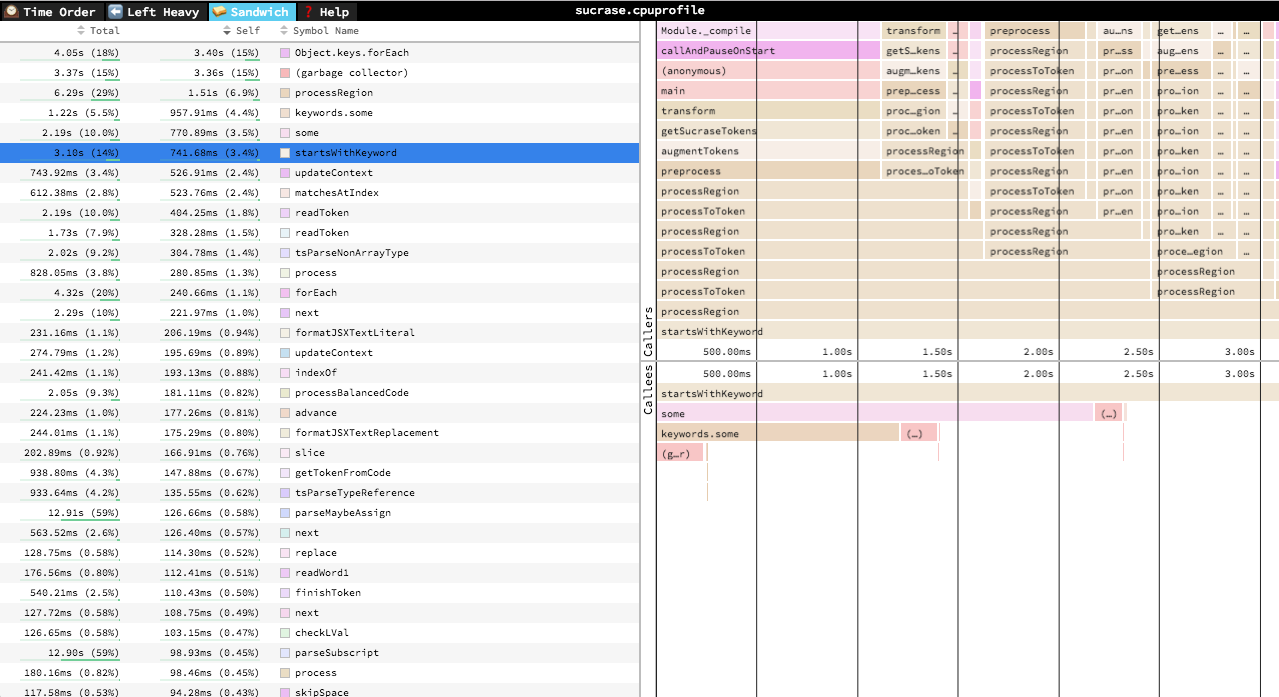
🥪 Sandwich
The Sandwich view is a table view in which you can find a list of all functions and their associated times. You can sort by self time or total time.
It's called "Sandwich" view because if you select one of the rows in the table, you can see flamegraphs for all the callers and callees of the selected
row.
Navigation
Once a profile has loaded, the main view is split into two: the top area is the "minimap", and the bottom area is the "stack view".
Minimap Navigation
Scroll on either axis to pan around
Click and drag to narrow your view to a specific range
Stack View Navigation
Scroll on either axis to pan around
Pinch to zoom
Hold Cmd+Scroll to zoom
Double click on a frame to fit the viewport to it
Click on a frame to view summary statistics about it
Keyboard Navigation
+: zoom in
-: zoom out
0: zoom out to see the entire profile
w/a/s/d or arrow keys: pan around the profile
1: Switch to the "Time Order" view
2: Switch to the "Left Heavy" view
3: Switch to the "Sandwich" view
r: Collapse recursion in the flamegraphs
Cmd+S/Ctrl+S to save the current profile
Cmd+O/Ctrl+O to open a new profile
n: Go to next profile/thread if one is available
p: Go to previous profile/thread if one is available
t: Open the profile/thread selector if available
Cmd+F/Ctrl+F: to open search. While open, Enter and Shift+Enter cycle through results
Contributing
Do you want to contribute to speedscope? Sweeeeet. Check out CONTRIBUTING.md for instructions on setting up your dev environment.
Yes — ohmyzsh/trace.ohmyz.sh ships under the MIT license, which makes its source code freely readable (and, depending on license terms, forkable and reusable). Source: github.com/ohmyzsh/trace.ohmyz.sh.
What is ohmyzsh/trace.ohmyz.sh?
ohmyzsh/trace.ohmyz.sh (ohmyzsh/trace.ohmyz.sh) is a TypeScript project on GitHub. From the project's own README: 🔬 A fast, interactive web-based viewer for performance tracing of zsh, with all heavy lifting done thanks to speedscope.app 💪
What license does ohmyzsh/trace.ohmyz.sh use?
ohmyzsh/trace.ohmyz.sh is released under the MIT license. Always verify the LICENSE file directly on GitHub for the authoritative terms — license strings can be edited out of sync with a project's actual stance.
Where can I see ohmyzsh/trace.ohmyz.sh in action?
The project maintains a homepage at https://trace.ohmyz.sh. The README tab on this page also usually contains screenshots and a quickstart.
Where do I read more about ohmyzsh/trace.ohmyz.sh?
This TopGit page is a snapshot — the READ ME tab shows the project's own README content (links stripped, images preserved). The GitHub repository at github.com/ohmyzsh/trace.ohmyz.sh is the definitive source.
Read full README in the tab above.
Is trace.ohmyz.sh worth your time?
ChatGPT, Claude and Perplexity can all read this page. Ask one of them what it makes of trace.ohmyz.sh.
 /trace.ohmyz.sh