TopGit tracks ropensci/stplanr on GitHub. The project has 443 stars. Sustainable transport planning with R
Snapshot summary built from the project's own GitHub metadata — there's no written TopGit review yet. The page will update automatically when a full review is published.
WHY NO REVIEW YET
TopGit writes full reviews for the most-starred, most-requested repositories. This page is a snapshot until then — see the READ ME tab for the original README in full.
stplanr is a package for sustainable transport planning with R.
It provides functions for solving common problems in transport planning
and modelling, such as how to best get from point A to point B. The
overall aim is to provide a reproducible, transparent and accessible
toolkit to help people better understand transport systems and inform
policy, as outlined in a
paper
about the package, and the potential for open source software in
transport planning in general, published in the R
Journal.
The initial work on the project was funded by the Department of
Transport
(DfT)
as part of the development of the Propensity to Cycle Tool (PCT), a web
application to explore current travel patterns and cycling potential at
zone, desire line, route and route network levels (see
www.pct.bike and click on a region to try it
out). The basis of the methods underlying the PCT is origin-destination
data, which are used to highlight where many short distance trips are
being made, and estimate how many could switch to cycling. The results
help identify where cycleways are most needed, an important component of
sustainable transport planning infrastructure engineering and policy
design.
See the package vignette (e.g. via vignette("introducing-stplanr")) or
an academic paper on the Propensity to Cycle Tool
(PCT) for more information on
how it can be used. This README provides some basics.
Much of the work supports research undertaken at the Leeds’ Institute
for Transport Studies (ITS)
but stplanr should be useful to transport researchers and
practitioners needing free, open and reproducible methods for working
with geographic data everywhere.
Key functions
Data frames representing flows between origins and destinations must be
combined with geo-referenced zones or points to generate meaningful
analyses and visualisations of ‘flows’ or origin-destination (OD) data.
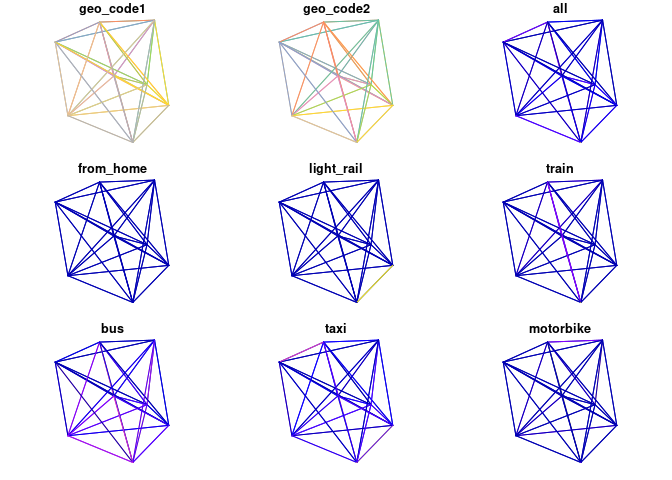
stplanr facilitates this with od2line(), which takes flow and
geographical data as inputs and outputs spatial data. Some example data
is provided in the package:
travel_network <- od2line(flow = od_data_sample, zones = cents_sf)
w <- flow$all / max(flow$all) *10
plot(travel_network, lwd = w)
stplanr has many functions for working with OD data. See the
stplanr-od
vignette for details.
The package can also allocate flows to the road network, e.g. with
CycleStreets.net and the
OpenStreetMap Routing Machine
(OSRM) API interfaces.
These are supported in route_*() functions such as
route_cyclestreets and route_osrm():
Routing can be done using a range of back-ends and using lat/lon or
desire line inputs with the route() function, as illustrated by the
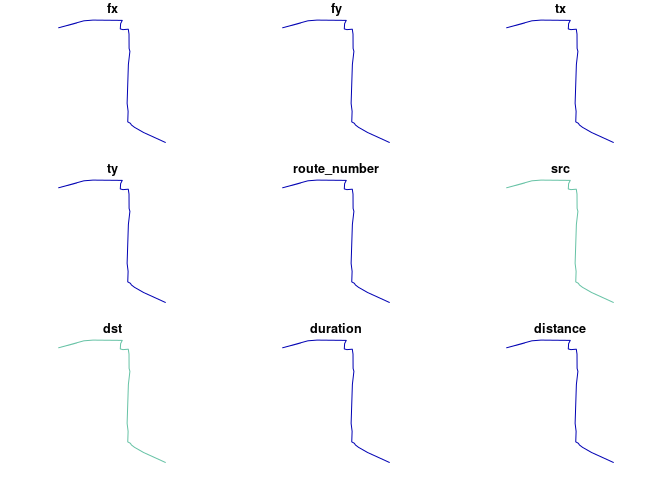
following commands which calculates the route between Fleet Street and
Southwark Street over the River Thames on Blackfriars Bridge in London:
library(osrm)
#> Data: (c) OpenStreetMap contributors, ODbL 1.0 - http://www.openstreetmap.org/copyright
#> Routing: OSRM - http://project-osrm.org/
trip <- route(
  from = c(-0.11, 51.514),
  to = c(-0.10, 51.506),
  route_fun = osrmRoute,
  returnclass = "sf"
  )
#> Warning: "returnclass" is deprecated.
#> Most common output is sf
plot(trip)
You can also use and place names, found using the Google Map API:
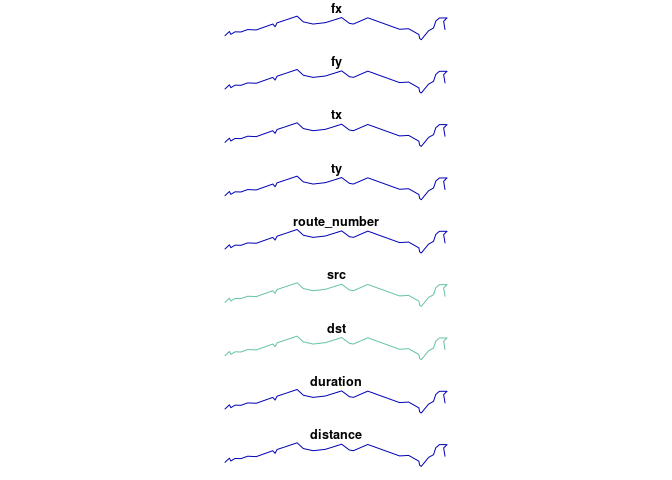
trip2 <- route(
  from = "Leeds",
  to = "Bradford",
  route_fun = osrmRoute,
  returnclass = "sf"
  )
#> Warning: "returnclass" is deprecated.
#> Most common output is sf
plot(trip2)
We can replicate this call multiple times with the l argument in
route():
desire_lines <- travel_network[2:6, ]
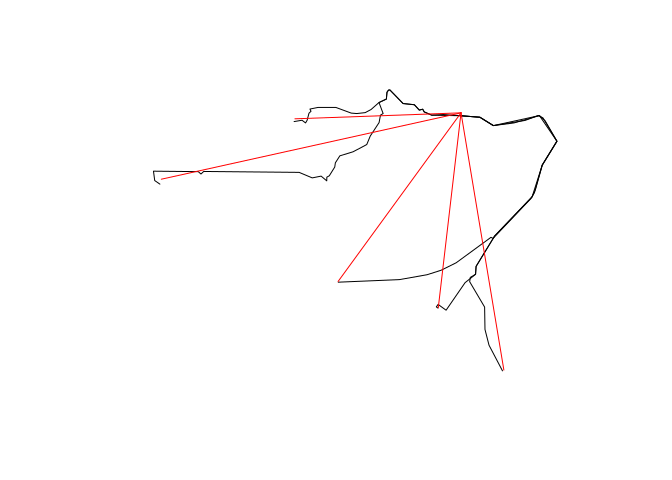
Next, we’ll calculate the routes:
routes <- route(
  l = desire_lines,
  route_fun = osrmRoute,
  returnclass = "sf"
  )
#> Warning: "returnclass" is deprecated.
#> Warning: "returnclass" is deprecated.
#> Warning: "returnclass" is deprecated.
#> Warning: "returnclass" is deprecated.
#> Warning: "returnclass" is deprecated.
plot(sf::st_geometry(routes))
plot(desire_lines, col = "red", add = TRUE)
#> Warning in plot.sf(desire_lines, col = "red", add = TRUE): ignoring all but the
#> first attribute
For more examples, example("route").
overline() takes a series of route-allocated lines, splits them into
unique segments and aggregates the values of overlapping lines. This can
represent where there will be most traffic on the transport system, as
demonstrated in the following code chunk.
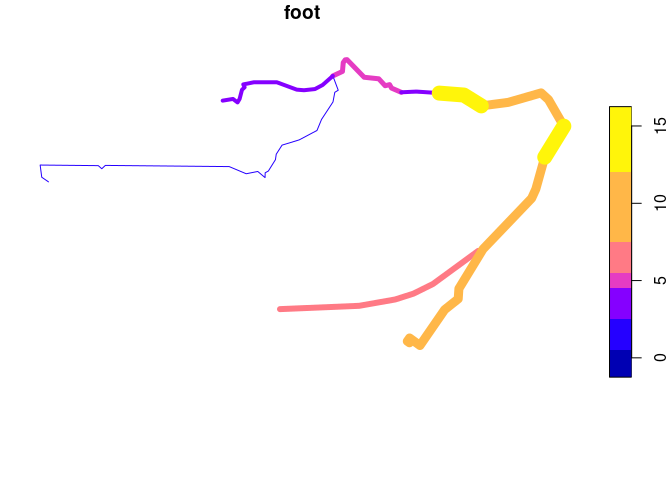
The resulting route network, with segment totals calculated from
overlapping parts for the routes for walking, can be visualised as
follows:
plot(rnet["foot"], lwd = rnet$foot)
The above plot represents the number walking trips made (the ‘flow’)
along particular segments of a transport network.
Policy applications
The examples shown above, based on tiny demonstration datasets, may not
seem particularly revolutionary. At the city scale, however, this type
of analysis can be used to inform sustainable transport policies, as
described in papers describing the Propensity to Cycle
Tool (PCT),
and its application to calculate cycling to school
potential across England.
Results generated by stplanr are now part of national government
policy: the PCT is the recommended tool for local and regional
authorities developing strategic cycle network under the Cycling and
Walking Infrastructure Strategy
(CWIS),
which is part of the Infrastructure Act
2015.
stplanr is helping dozens of local authorities across the UK to
answer the question: where to prioritise investment in cycling? In
essence, stplanr was designed to support sustainable transport policies.
There are many other research and policy questions that functions in
stplanr, and other open source software libraries and packages, can
help answer. At a time of climate, health and social crises, it is
important that technology is not only sustainable itself (e.g. as
enabled by open source communities and licenses) but that it contributes
to a sustainable future.
Installation
To install the stable version, use:
install.packages("stplanr")
The development version can be installed using devtools:
# install.packages("devtools") # if not already installed
devtools::install_github("ropensci/stplanr")
library(stplanr)
Installing stplanr on Linux and Mac
stplanr depends on sf. Installation instructions for Mac, Ubuntu
and other Linux distros can be found here:
https://github.com/r-spatial/sf#installing
Funtions, help and contributing
The current list of available functions can be seen on the package’s
website at
docs.ropensci.org/stplanr/, or
with the following command:
lsf.str("package:stplanr", all = TRUE)
To get internal help on a specific function, use the standard way.
?od2line
To contribute, report bugs or request features, see the issue
tracker.
Further resources / tutorials
Want to learn how to use open source software for reproducible
sustainable transport planning work? Now is a great time to learn.
Transport planning is a relatively new field of application in R.
However, there are already some good resources on the topic, including
(any further suggestions: welcome):
The Transport chapter of Geocomputation with R, which provides a
broad introduction from a geographic data perspective:
https://r.geocompx.org/transport.html
The stplanr paper, which describes the context in which the
package was developed:
https://journal.r-project.org/archive/2018/RJ-2018-053/index.html
(please cite this if you use stplanr in your work)
The dodgr vignette, which provides an introduction to routing in
R: https://github.com/UrbanAnalyst/dodgr
Meta
Please report issues, feature requests and questions to the github
issue tracker
License: MIT
Get citation information for stplanr in R doing
citation(package = 'stplanr')
This project is released with a Contributor Code of
Conduct.
By participating in this project you agree to abide by its terms.
ropensci/stplanr has 443 GitHub stars — refresh the page for the live number, or check github.com/ropensci/stplanr. TopGit mirrors GitHub's count but does not claim minute-by-minute accuracy.
Is ropensci/stplanr open source?
TopGit's metadata for ropensci/stplanr does not record a license. Most public repositories on GitHub ARE open source, but the exact terms vary — verify by opening the LICENSE file directly.
What is ropensci/stplanr?
ropensci/stplanr (ropensci/stplanr) is a R project on GitHub. From the project's own README: Sustainable transport planning with R
Where can I see ropensci/stplanr in action?
The project maintains a homepage at https://docs.ropensci.org/stplanr. The README tab on this page also usually contains screenshots and a quickstart.
Where do I read more about ropensci/stplanr?
This TopGit page is a snapshot — the READ ME tab shows the project's own README content (links stripped, images preserved). The GitHub repository at github.com/ropensci/stplanr is the definitive source.
Read full README in the tab above.
Curious whether stplanr is right for you?
Let ChatGPT, Claude, or Perplexity look into it — click below and see what AI actually says about stplanr.