How fast can PostgreSQL go?
Figures, Numbers, Benchmarks about how fast can PostgreSQL go!
-
https://github.com/Vonng/pgtpc
-
pgbench: Meaure PostgreSQL performence on different hardwares.
-
sysbench:Compare PostgreSQL performence with MySQL & other databases
-
tpc-h:Measure PostgreSQL Analysis performence and compare to other AP systems
-
Author: Vonng
PGBENCH
PostgreSQL have marvelous OTLP performence measured with pgbench (TPC-B Like).
Record: 2M point select QPS, 137K write TPS (1 Xact = 5 Queries / USUUI )
PGBENCH READ WRITE TPS
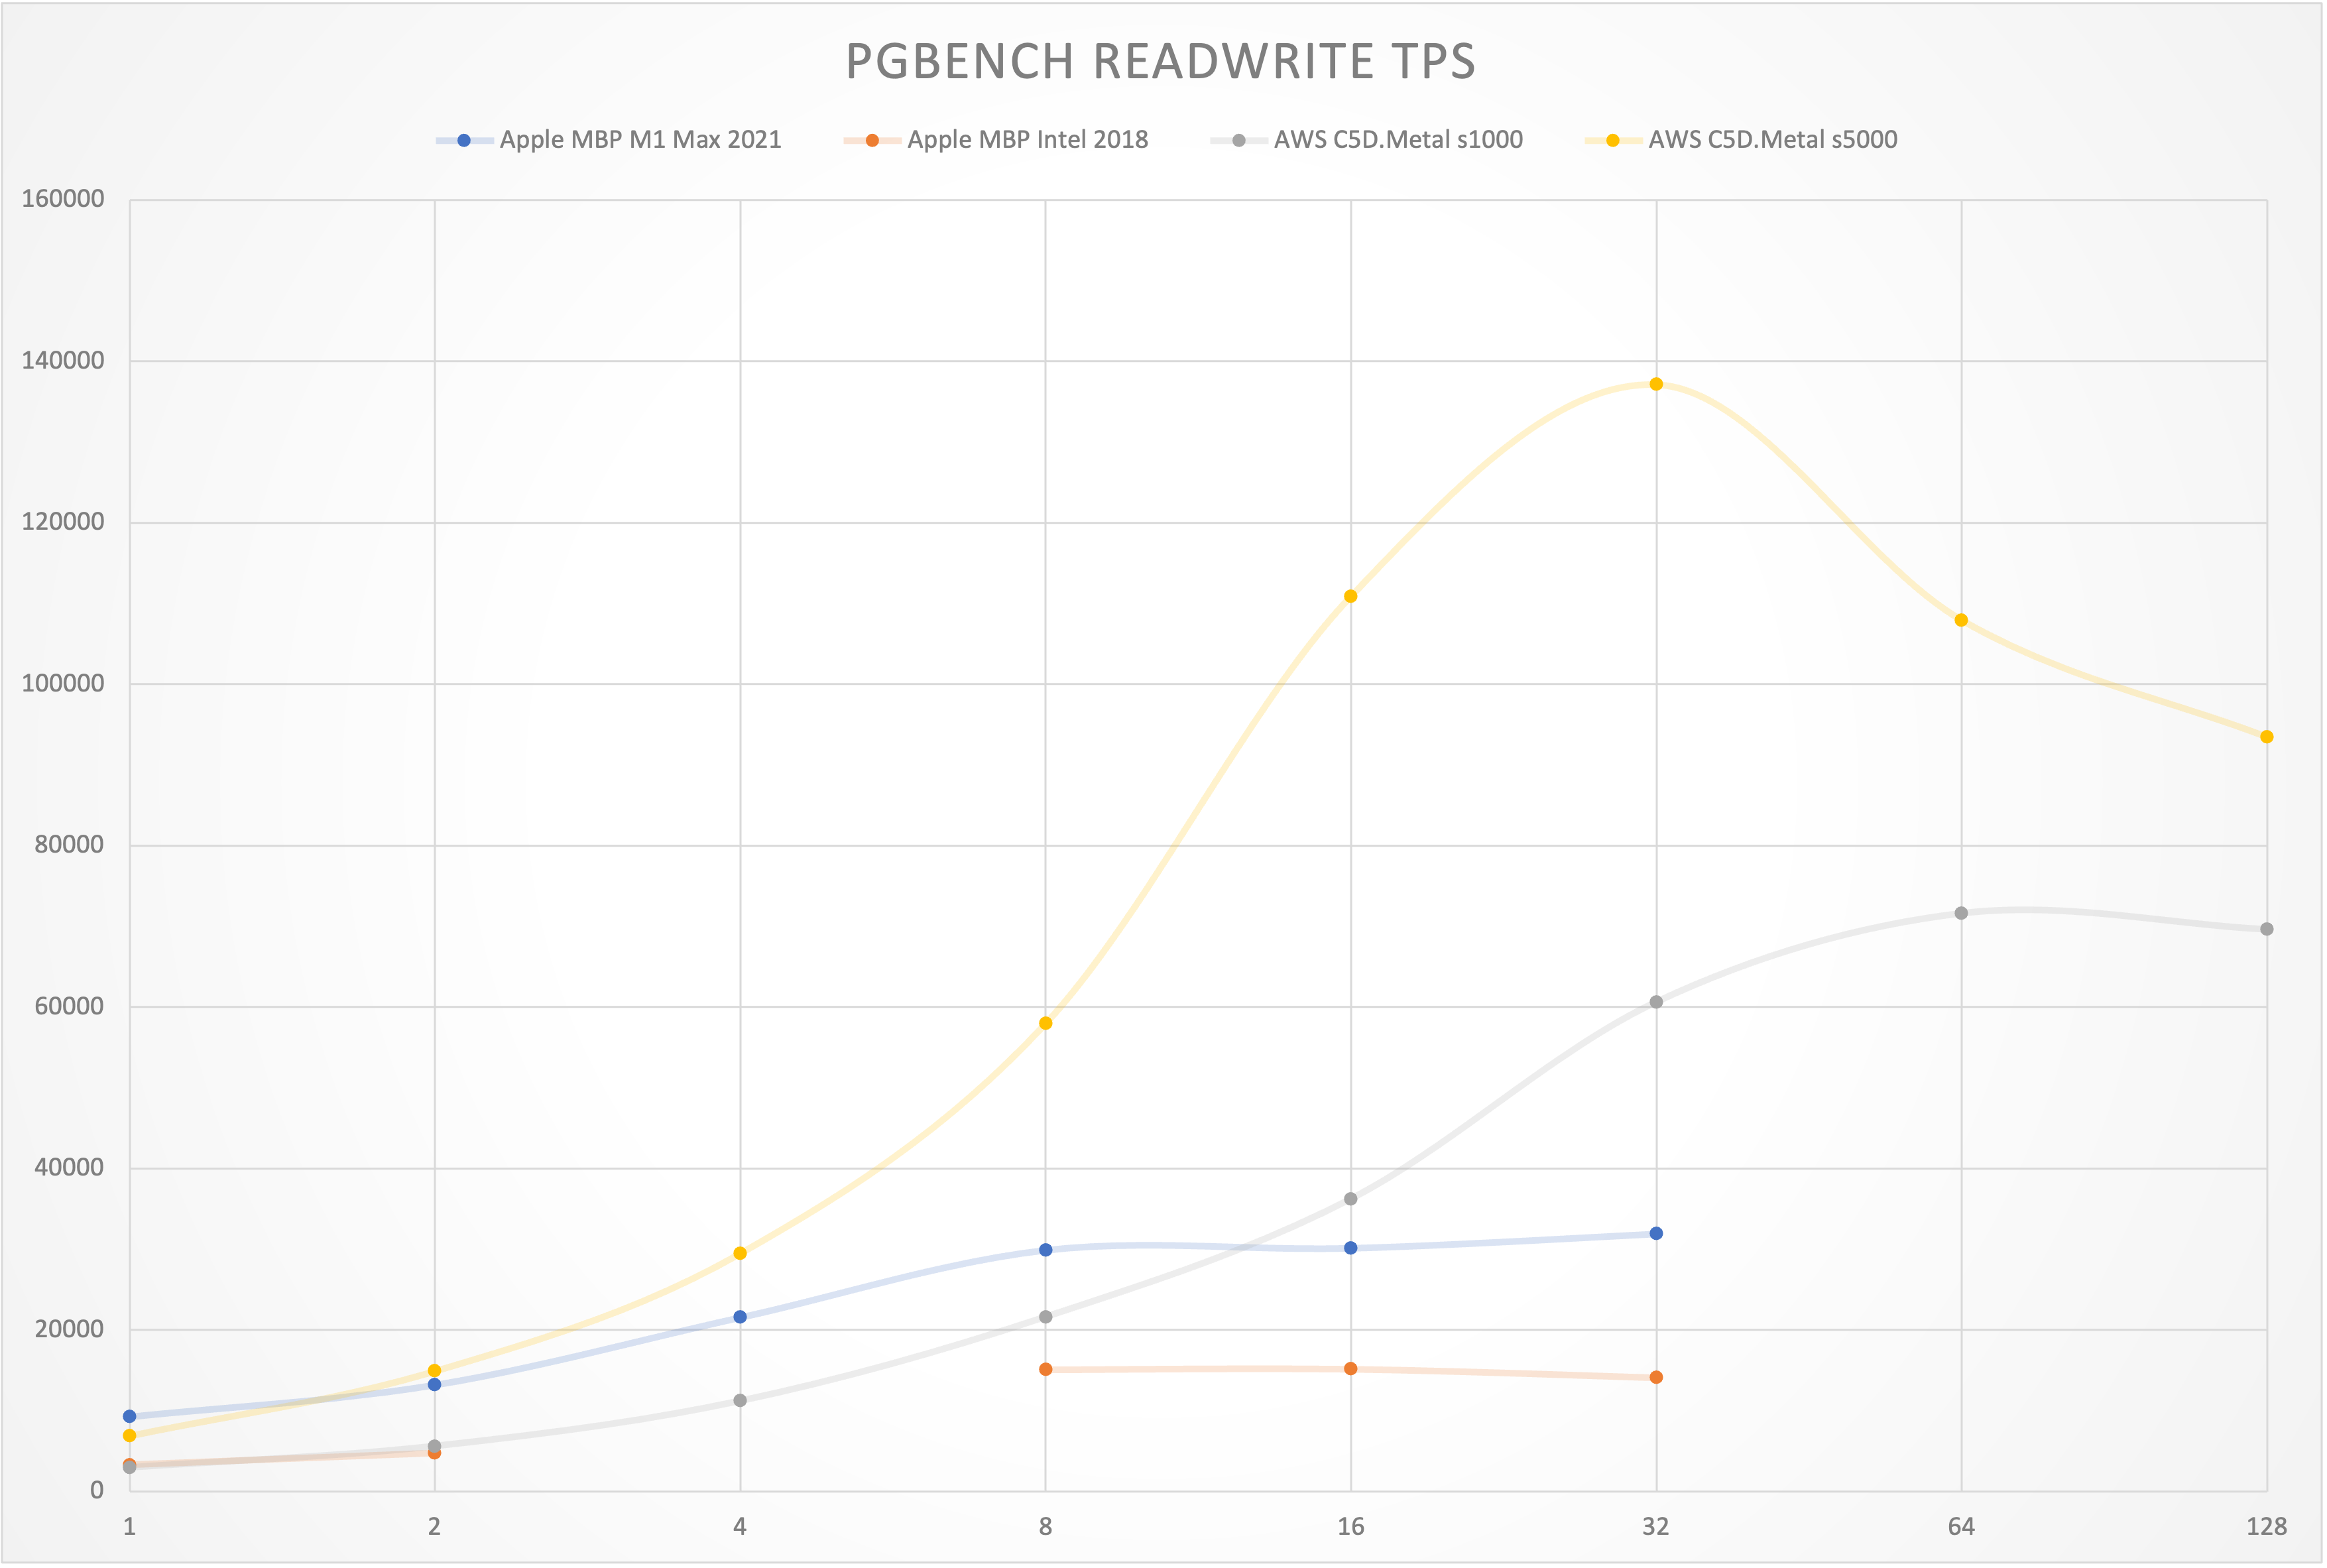
| RW TPS | 1 | 2 | 4 | 8 | 16 | 32 | 64 | 128 |
|---|
| Apple MBP M1 Max 2021 | 9254 | 13201 | 21549 | 29882 | 30130 | 31903 | | |
| Apple MBP Intel 2018 | 3301 | 4757 | | 15067 | 15141 | 14075 | | |
| AWS C5D.Metal s1000 | 2947 | 5602 | 11199 | 21607 | 36237 | 60636 | 71624 | 69629 |
| AWS C5D.Metal s5000 | 6864 | 14904 | 29481 | 57959 | 110893 | 137127 | 107960 | 93477 |
PGBENCH READ-ONLY TPS
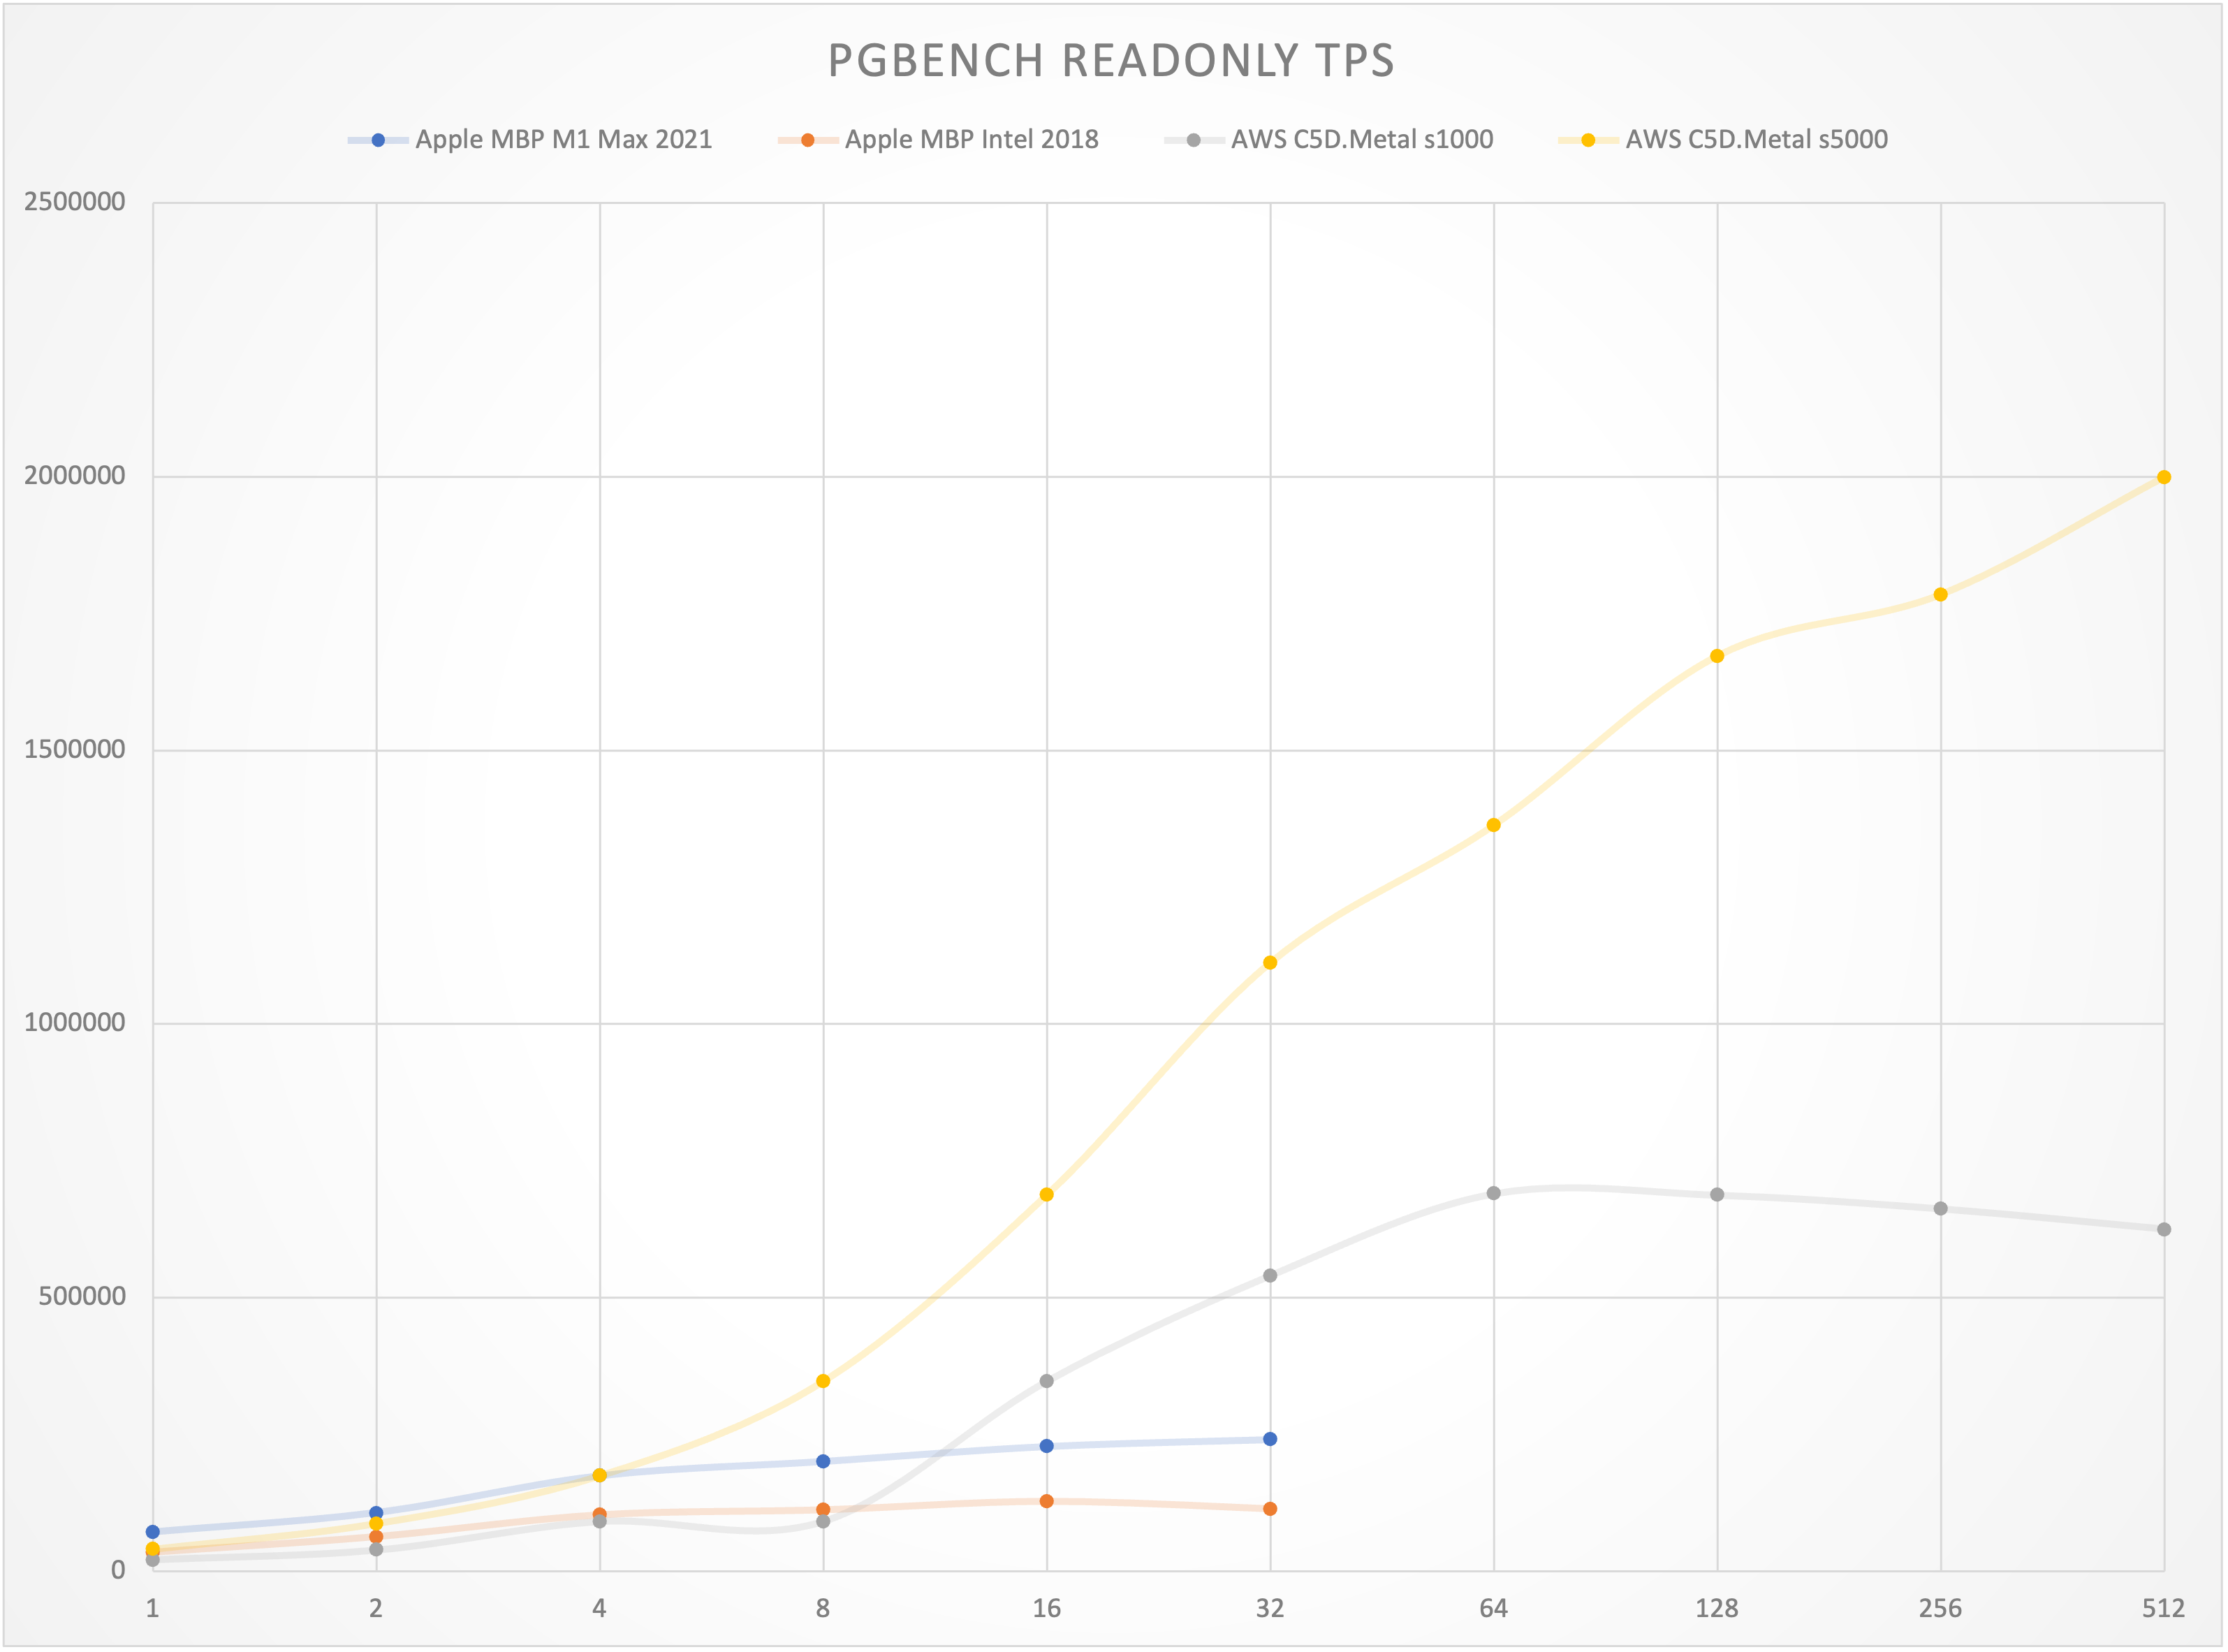
| RO TPS | 1 | 2 | 4 | 8 | 16 | 32 | 64 | 128 | 256 | 512 |
|---|
| Apple MBP M1 Max 2021 | 71748 | 107309 | 174629 | 200917 | 228209 | 240841 | | | | |
| Apple MBP Intel 2018 | 34715 | 63141 | 102741 | 112033 | 127438 | 113870 | | | | |
| AWS C5D.Metal s1000 | 21583 | 39309 | 91535 | 91535 | 347259 | 540355 | 689821 | 687448 | 662552 | 625849 |
| AWS C5D.Metal s5000 | 40284 | 87247 | 174382 | 346922 | 687244 | 1111431 | 1362714 | 1671769 | 1784125 | 1998580 |
SYSBENCH
PGSQL has a similar write performance and significantly better read performance to MySQL.
PGSQL & MYSQL both overwhelm several "Distributed Databases".
| Database | PGSQL.C5D96C | TiDB.108C | OceanBase.96C | PolarX.64C | Cockroach | Yugabyte |
|---|
| oltp_point_select | 1372654 | 407625 | 401404 | | 336000 | 95695 |
| oltp_read_only | 852440 | | 279067 | 366863 | | 52416 |
| oltp_read_write | 519069 | 124460 | 157859 | 177506 | | 9740 |
| oltp_write_only | 495942 | | 119307 | | | 9090 |
| oltp_delete | 839153 | | | | | 67499 |
| oltp_insert | 164351 | | | | 112000 | 6348 |
| oltp_update_non_index | 217626 | 62084 | | | | 11496 |
| oltp_update_index | 169714 | 26431 | | | | 4052 |
| select_random_points | 227623 | | | | | |
| select_random_ranges | 24632 | | | | | |
| Machine | c5d.metal | m5.xlarge x3 i3.4xlarge x3 c5.4xlarge x3 | ecs.hfg7.8xlarge x3 ecs.hfg7.8xlarge x1 | Enterprise | c5d.9xlarge x3 | c5.4xlarge x3 |
| Spec | 96C 192G | 108C 510G | 96C 384G | 64C 256G | 108C 216G | 48C 96G |
| Table | 16 x 10M | 16 x 10M | 30 x 10M | 1 x 160M | N/A | 10 x 0.1M |
| CPU | 96 | 108 | 96 | 64 | 108 | 48 |
| Source | Vonng | TiDB | OceanBase | PolarDB | Cockroach | YugaByte |
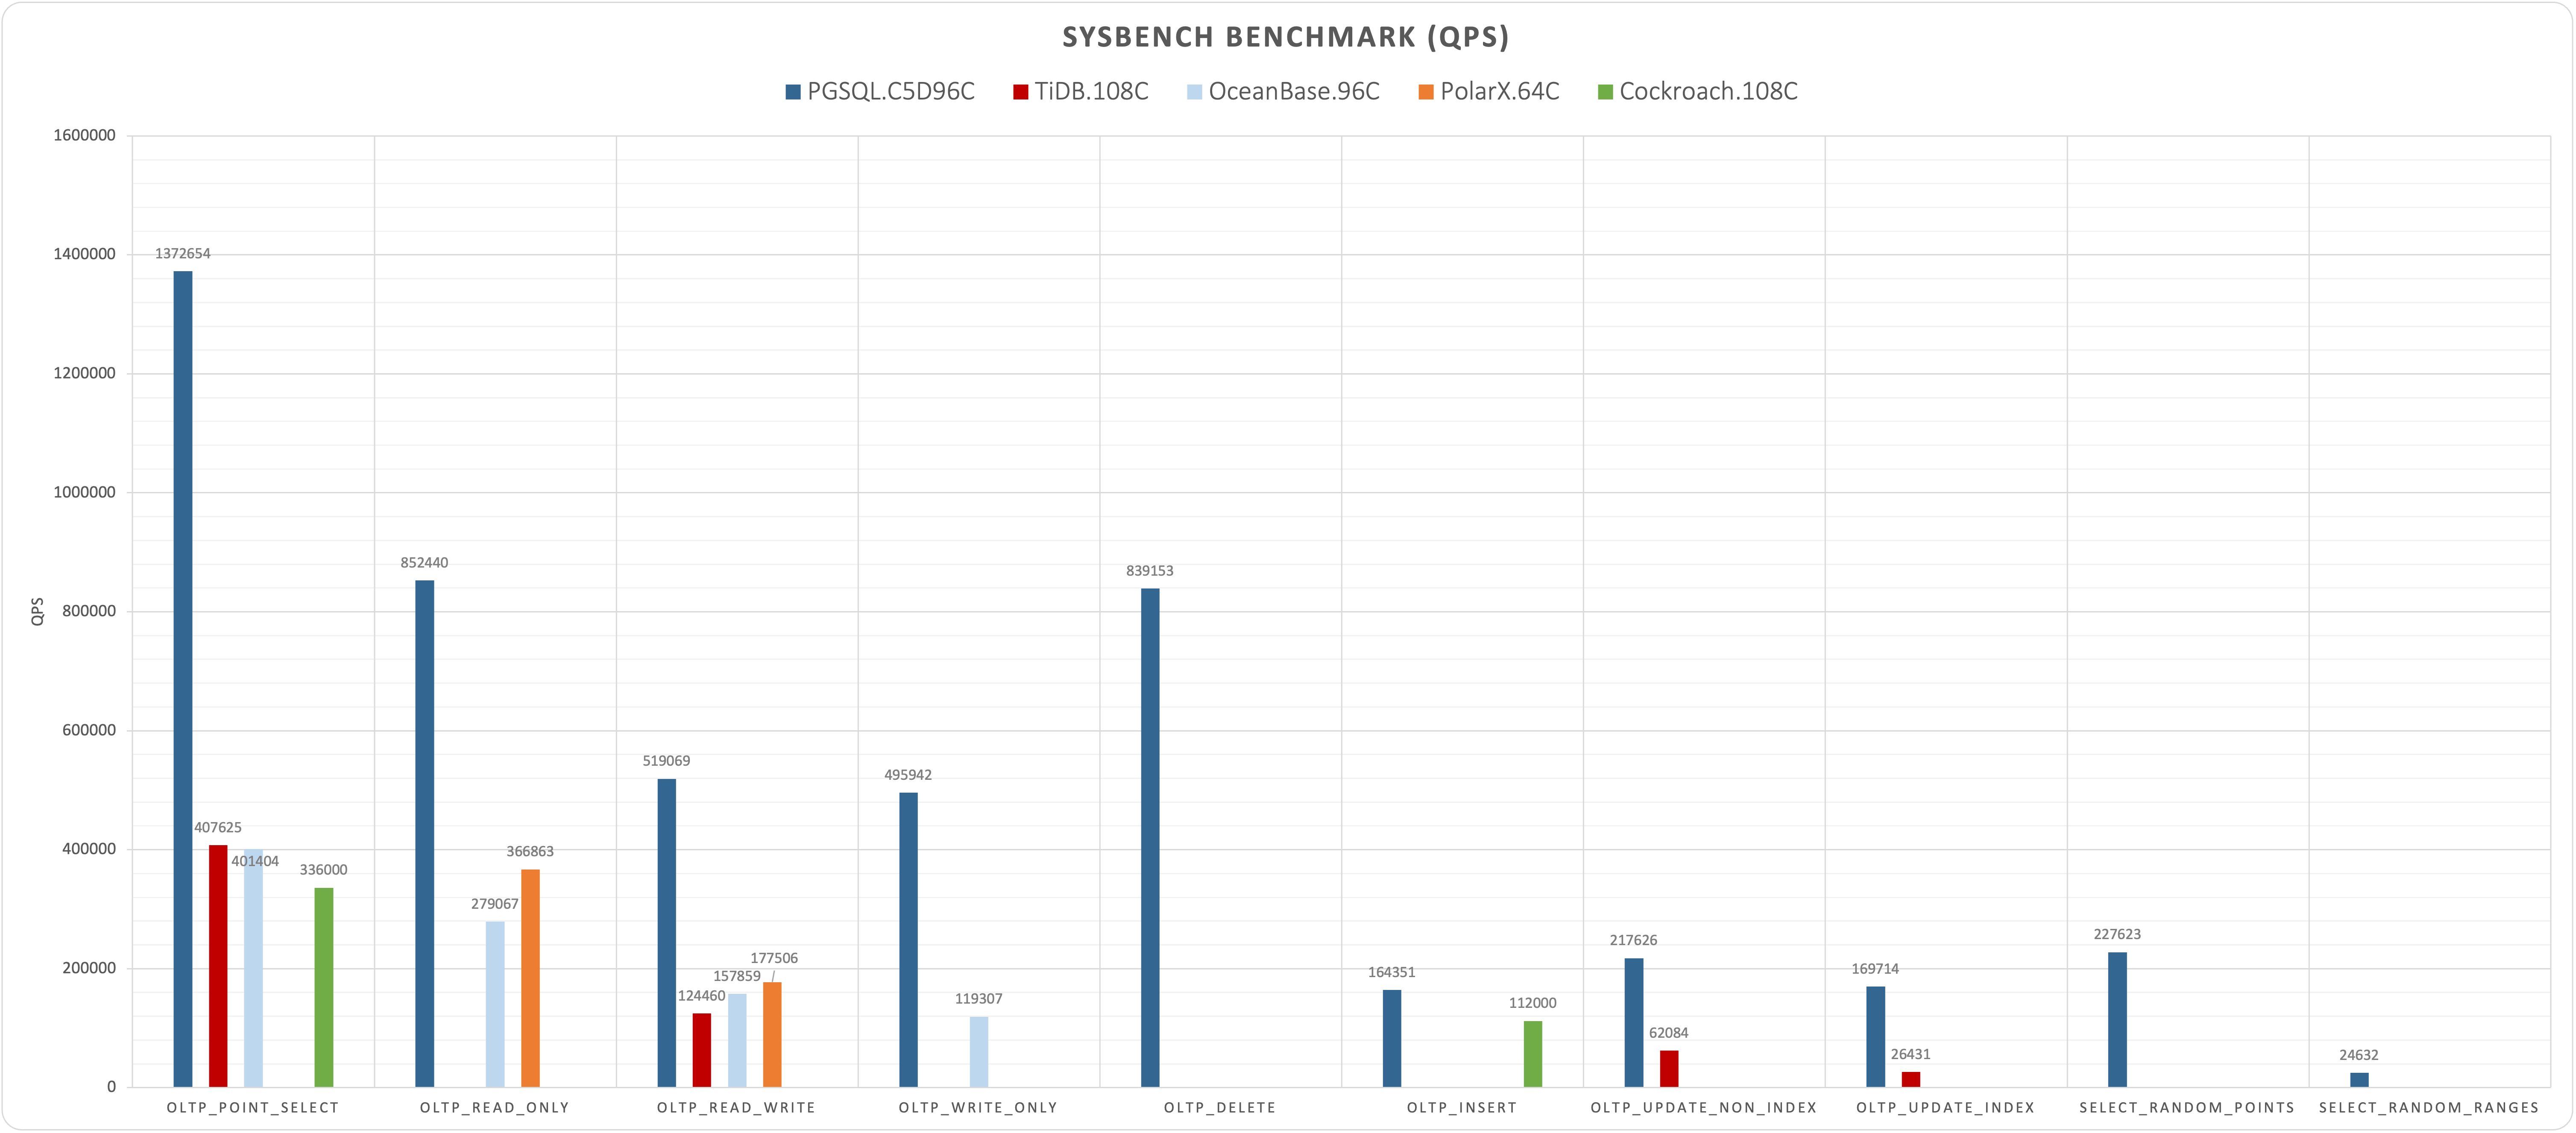
Sysbench: Fair Play
If we normalize QPS performence with CPU cores used, it will be like:
| Testcase | PGSQL | TiDB | OceanBase | PolarX | Cockroach | Yugabyte |
|---|
| oltp_point_select | 14298 | 3774 | 4181 | | 3111 | 1994 |
| oltp_read_only | 8880 | | 2907 | 5732 | | 1092 |
| oltp_read_write | 5407 | 1152 | 1644 | 2774 | | 203 |
| oltp_write_only | 5166 | | 1243 | | | 189 |
| oltp_delete | 8741 | | | | | 1406 |
| oltp_insert | 1712 | | | | 1037 | 132 |
| oltp_update_non_index | 2267 | 575 | | | | 240 |
| oltp_update_index | 1768 | 245 | | | | 84 |
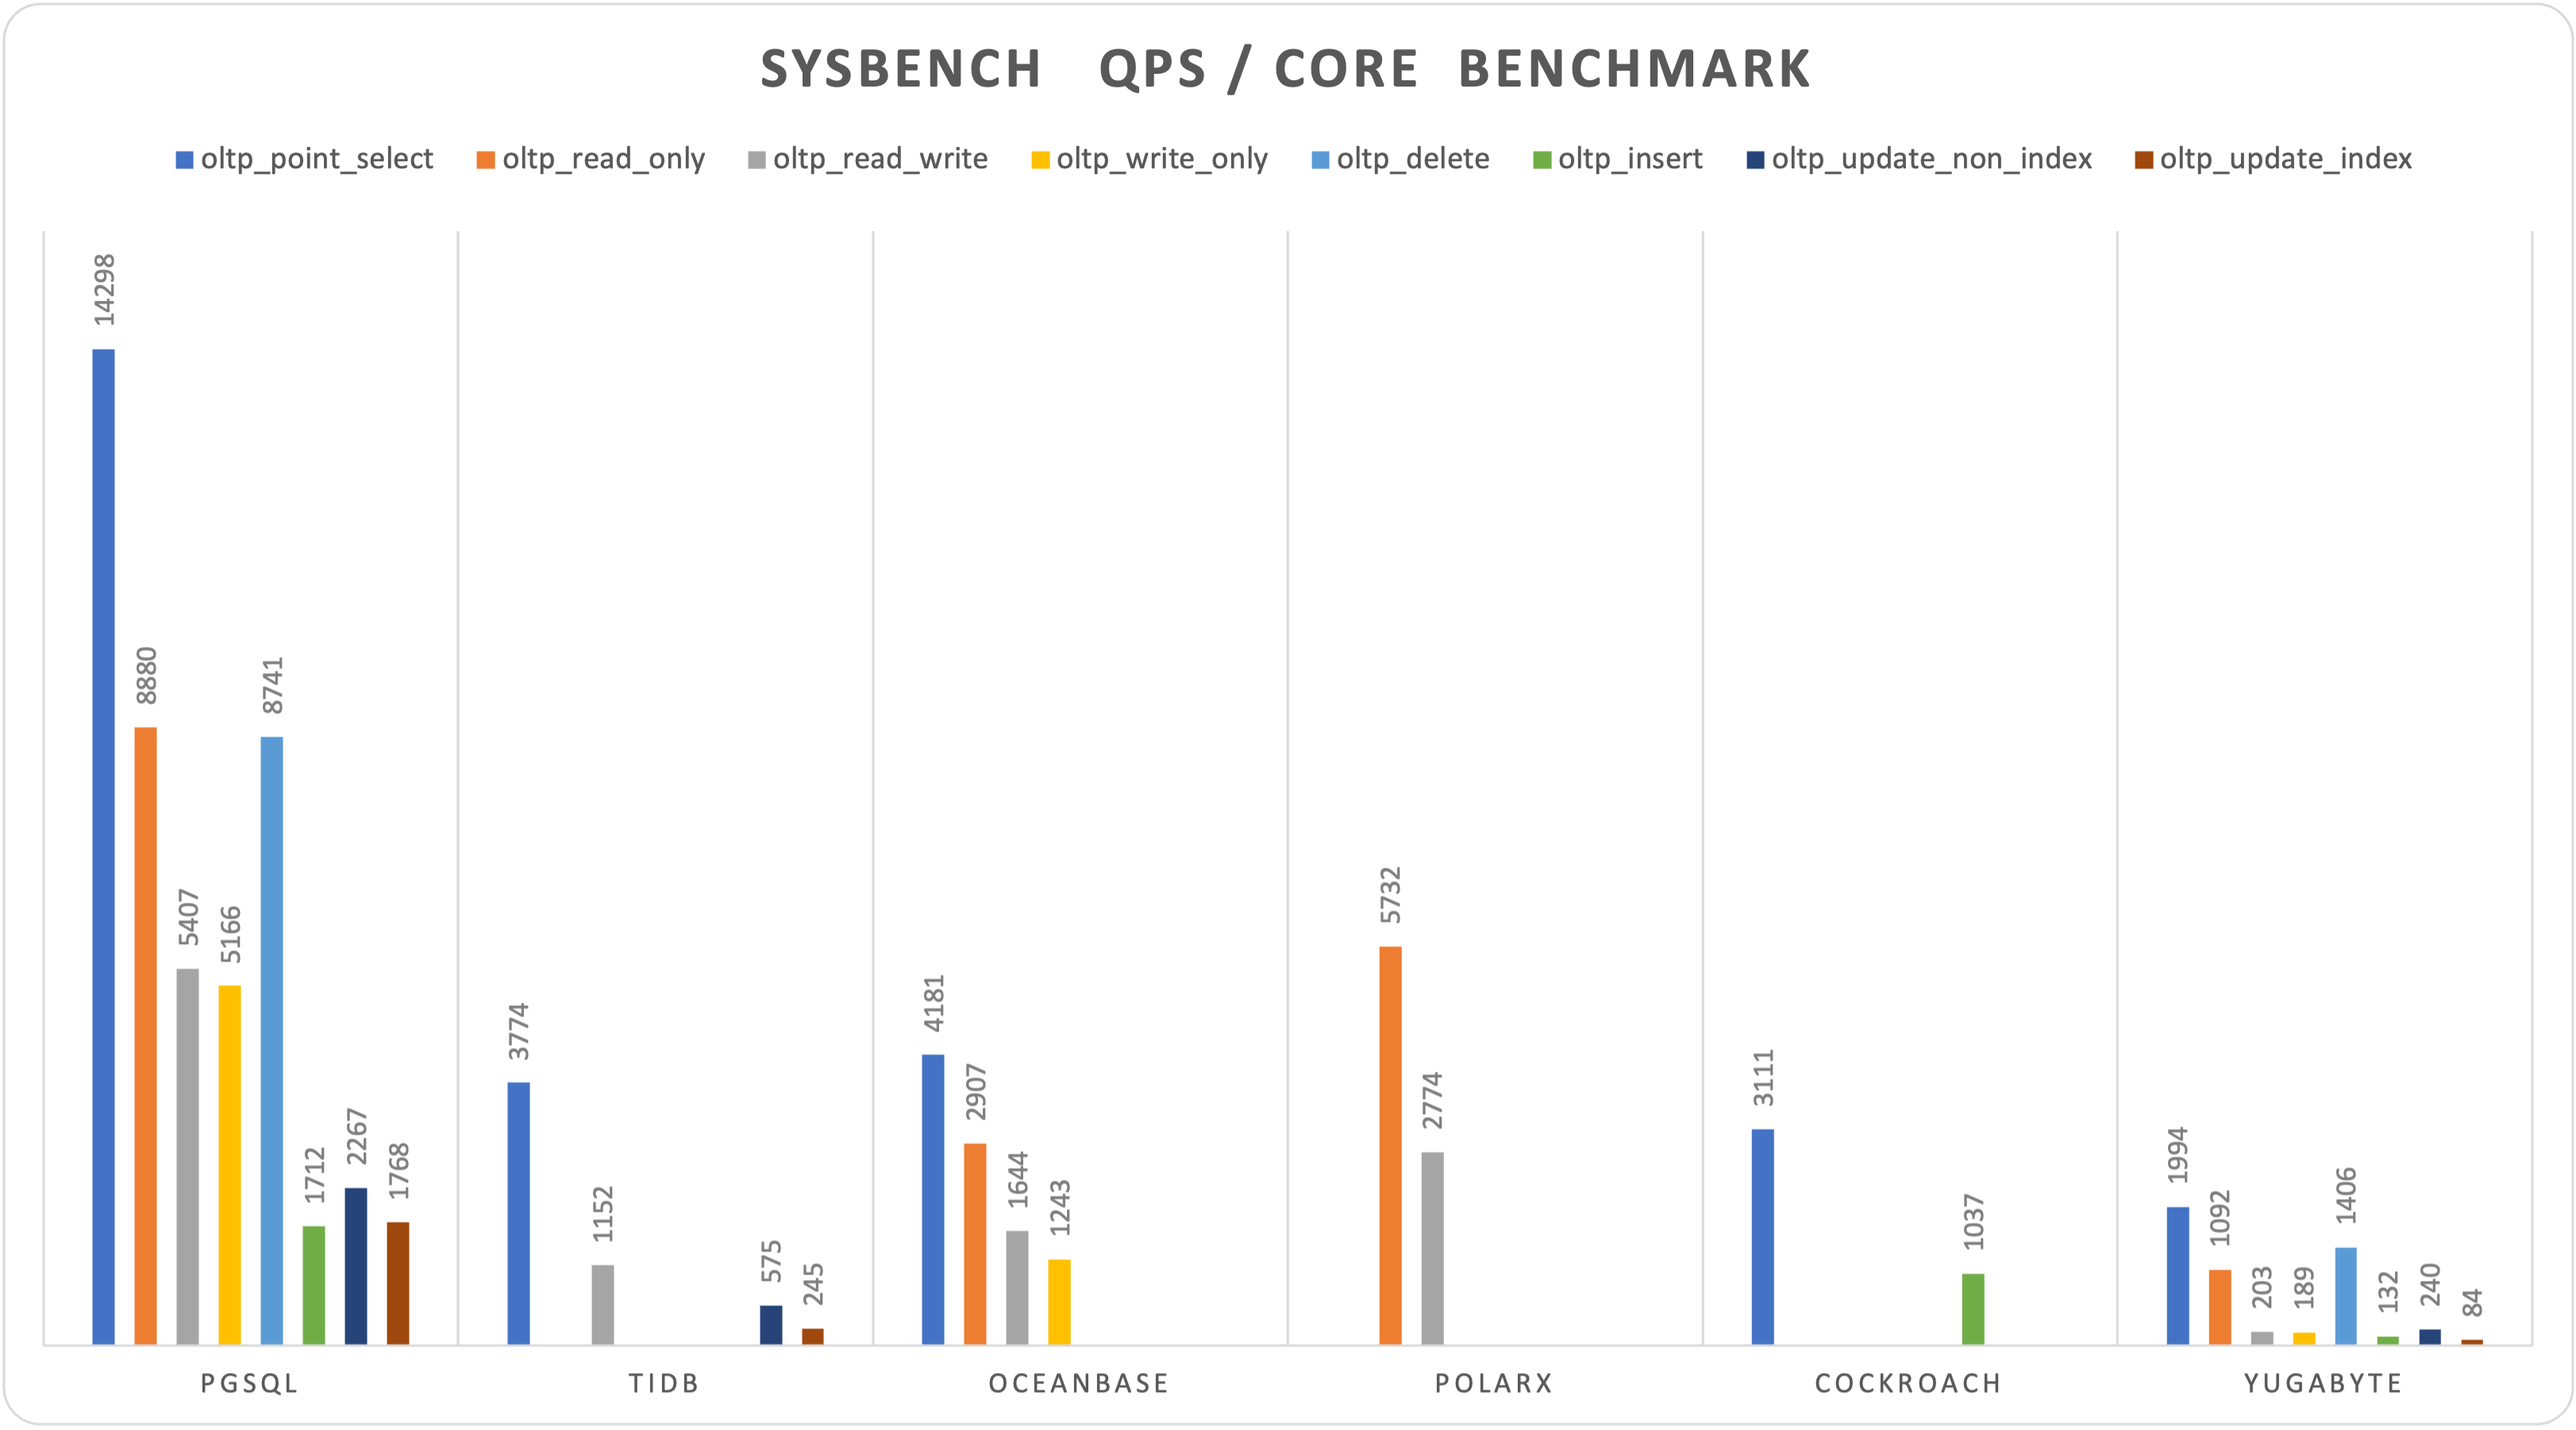
References
- AWS c5d.metal (NORMAL)
- Reference: TiDB 6.1
- Reference: OceanBase 3.1
- Reference: PolarDB-X
SYSBENCH: Dirty Hack
PGSQL vs MySQL: OLTP Performence
MySQL Official Site - Why MySQL - Benchmarks - MySQL 8.0 Have a blantant bench result.
Which turns off checksum, double write, binlog, PFS, and fsync and use latin-1 charset. Which makes it a toy and impossible to use in real-world production environment.
However we can using the same dirty hack in PostgreSQL and see how far it goes.
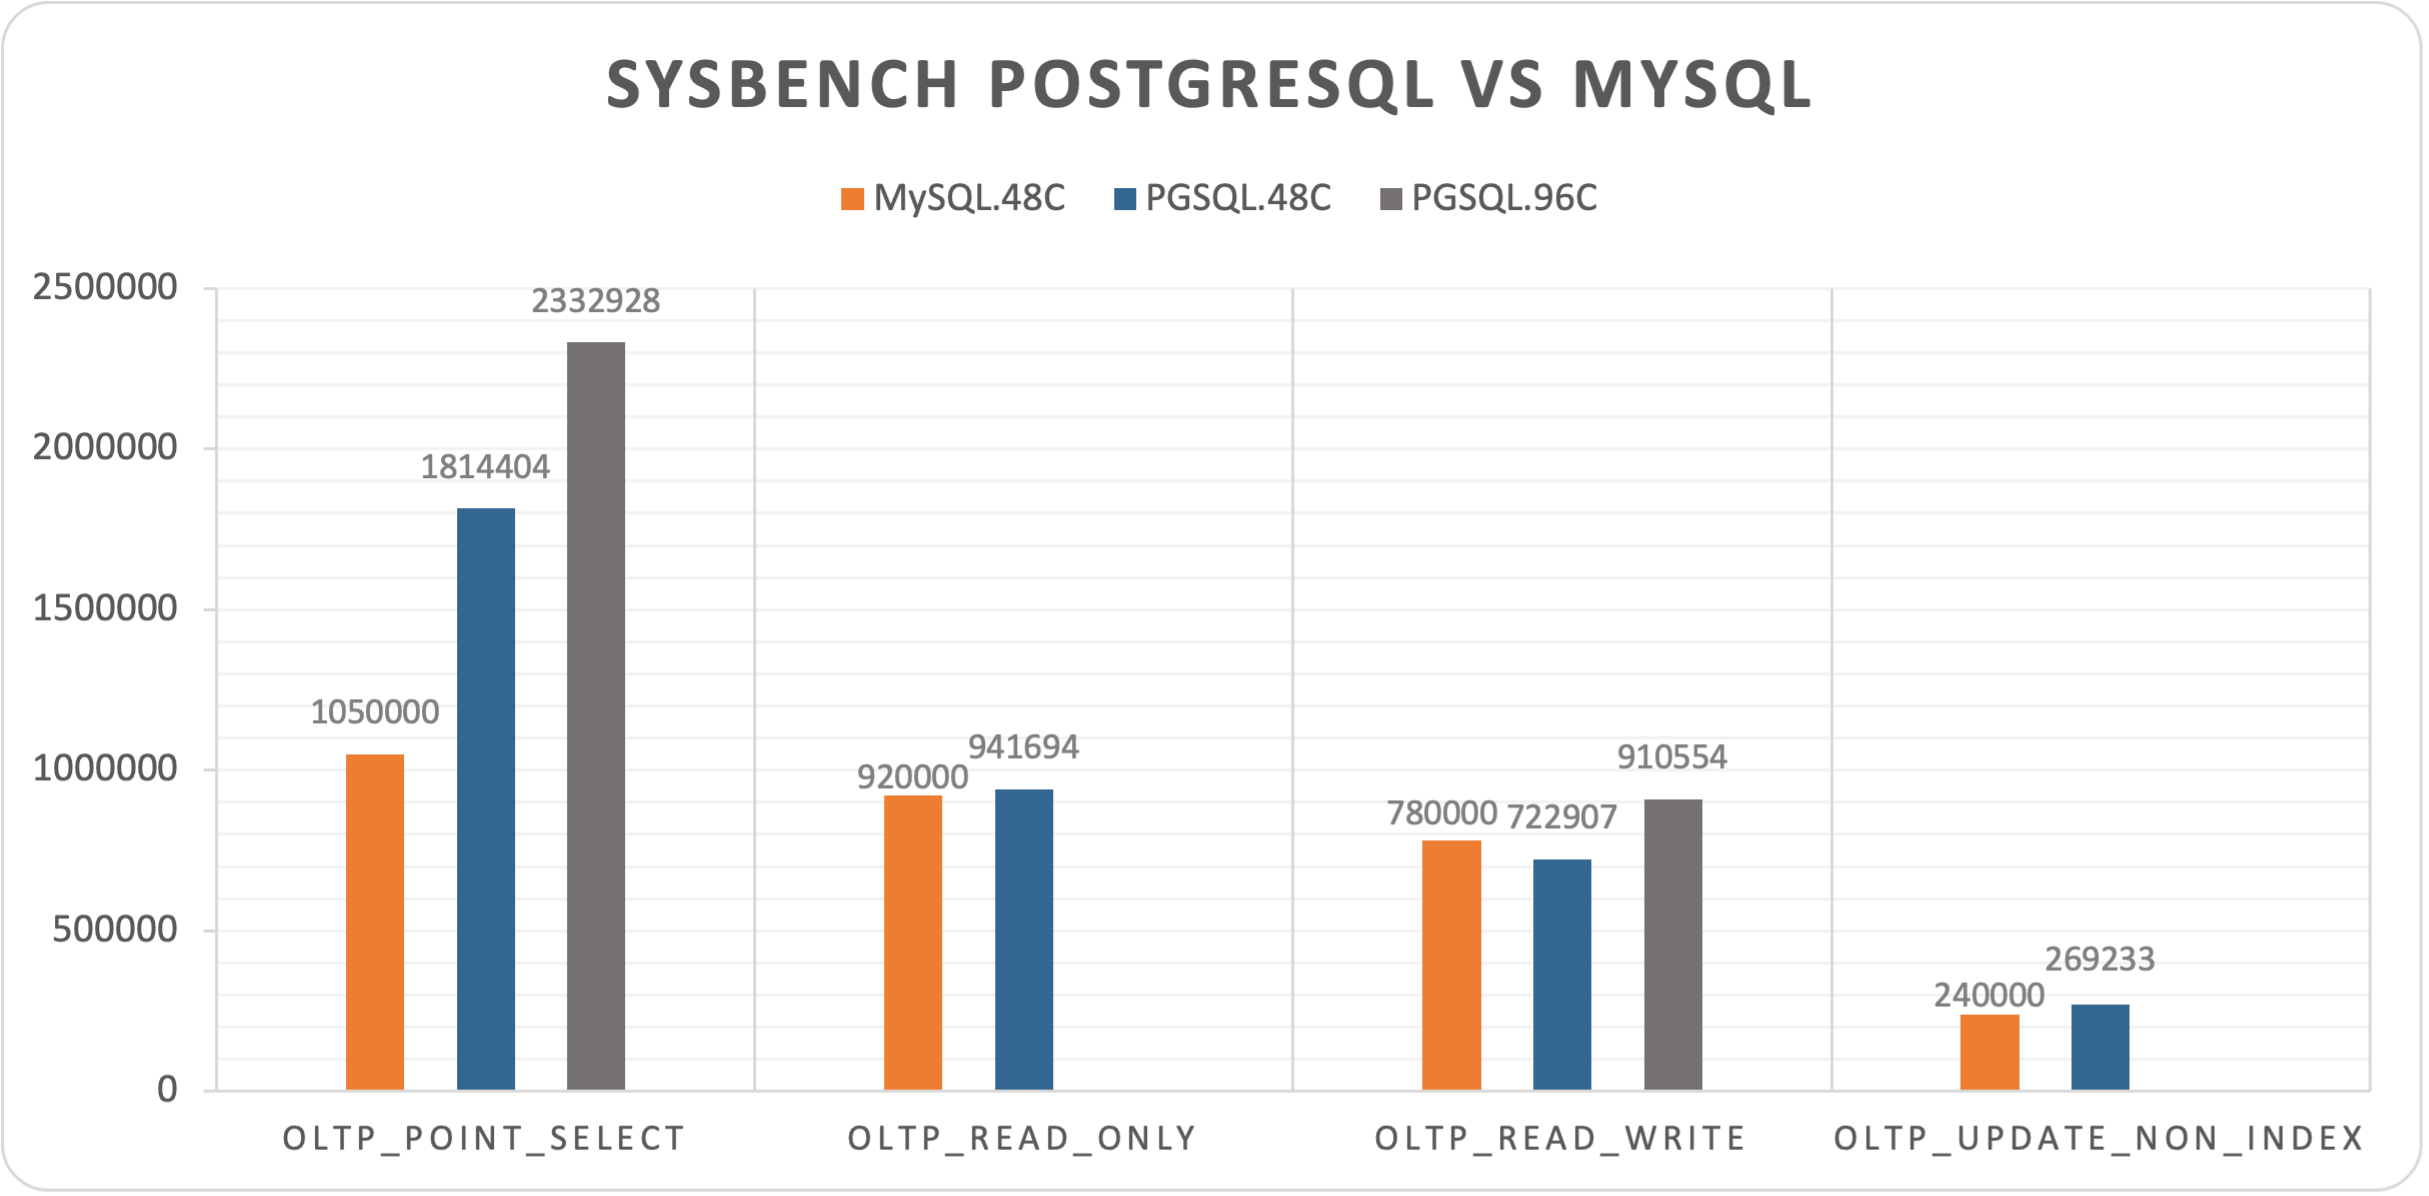
- Reference: MySQL
- AWS c5d.metal (EXTREME)
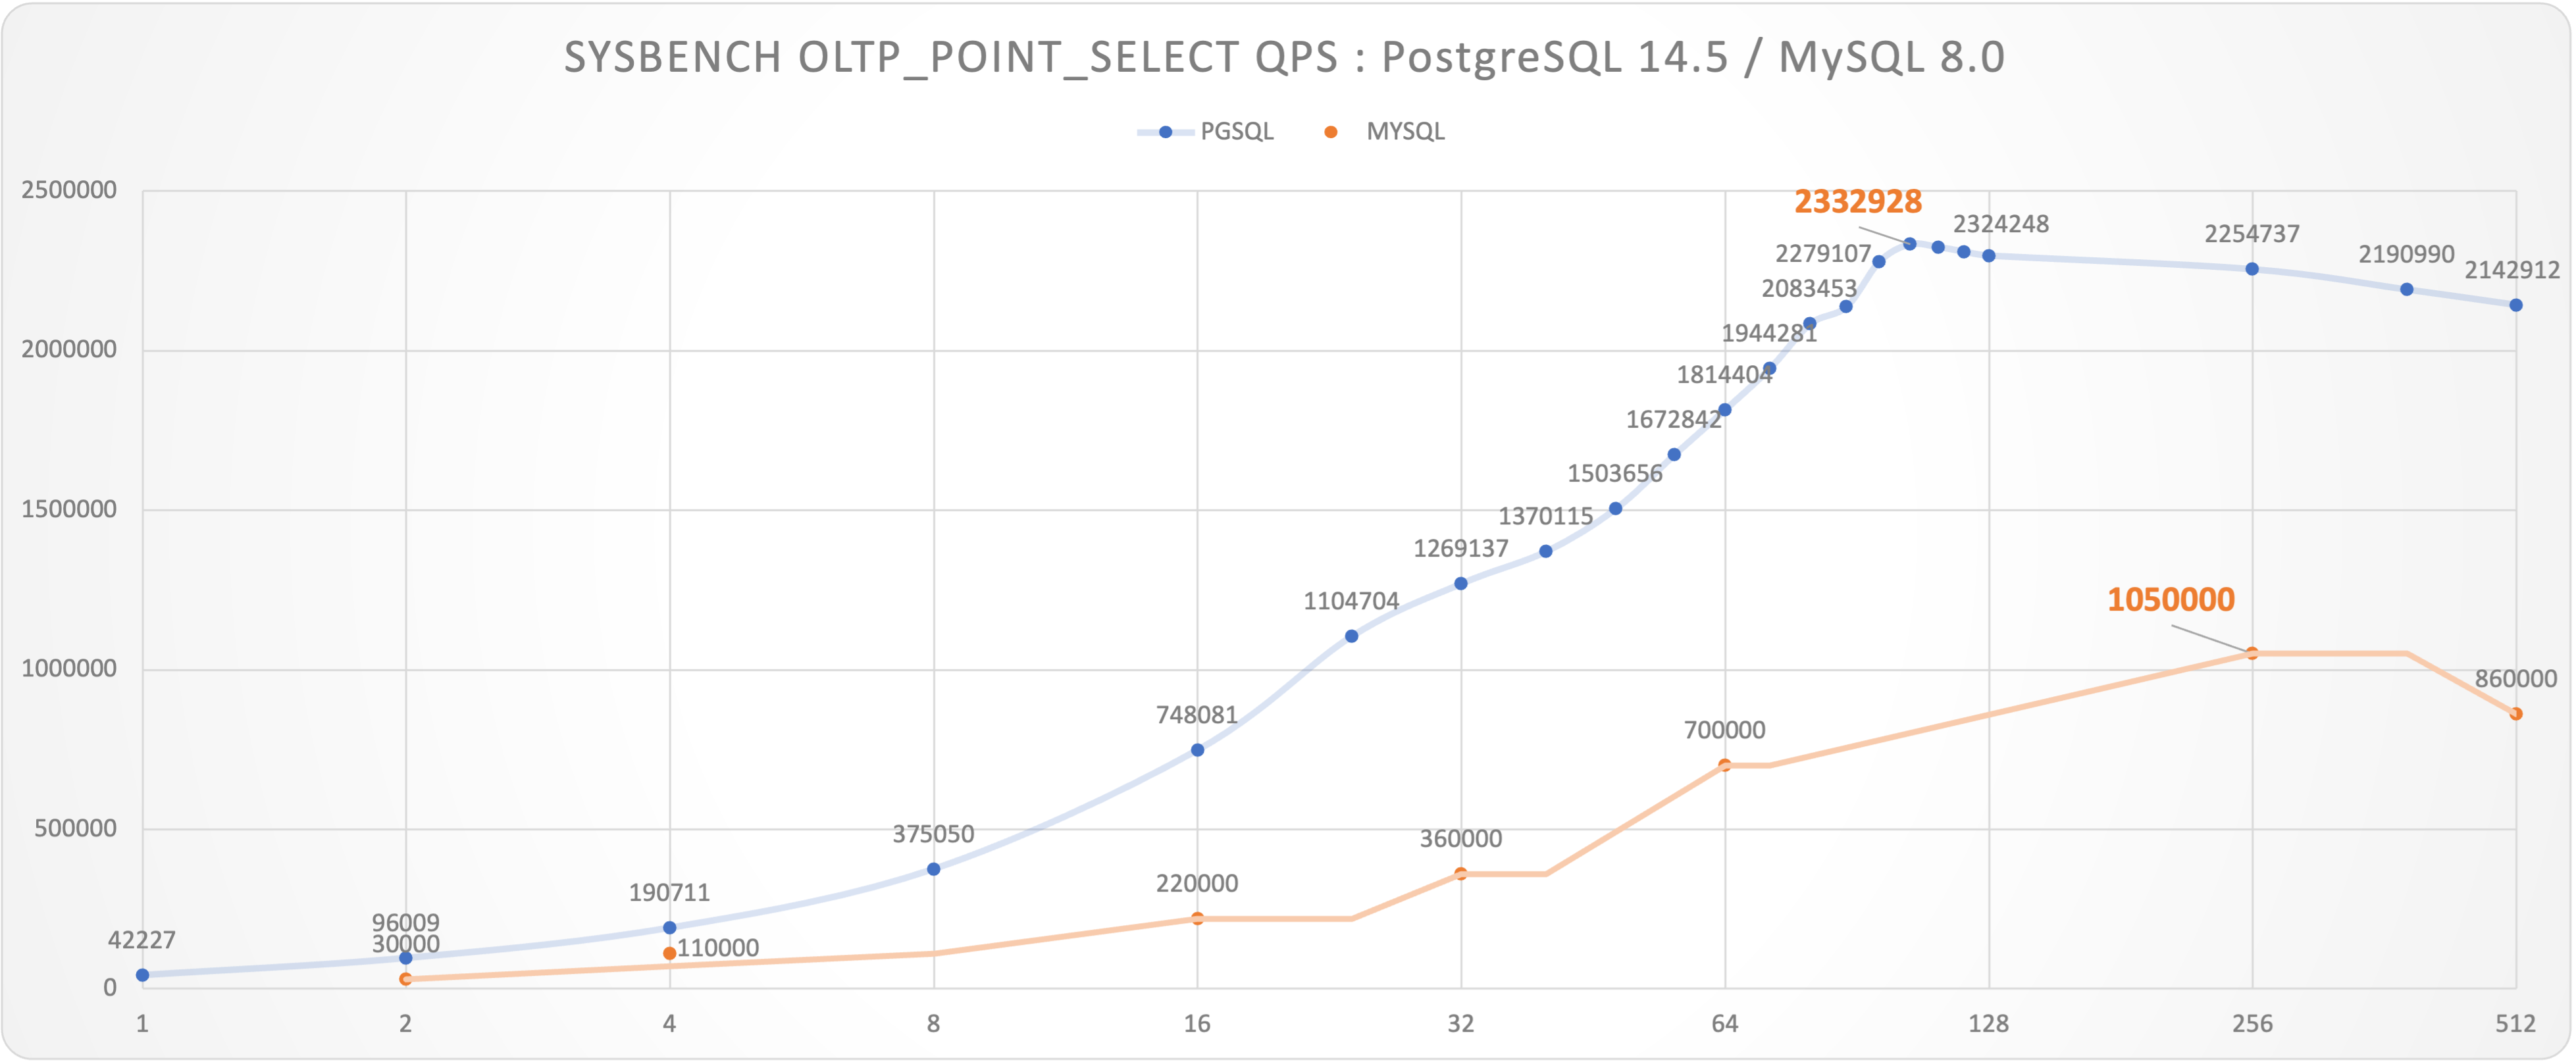
PGSQL vs MySQL: OLTP Point Select
TPC-H
PostgreSQL has pretty good OLAP performence / effect comparing to other Ad-hoc AP systems.
PostgreSQL can finish tpc-h50 in 22min, and tpc-h100 in 80min on a 10C laptop.
| Scale Factor | Time (s) | CPU | Environment | Comment |
|---|
| 1 | 8 | 10 | 10C / 64G | apple m1 max |
| 10 | 56 | 10 | 10C / 64G | apple m1 max |
| 50 | 1327 | 10 | 10C / 64G | apple m1 max |
| 100 | 4835 | 10 | 10C / 64G | apple m1 max |
| 1 | 13.51 | 8 | 8C / 64G | z1d.2xlarge |
| 10 | 133.35 | 8 | 8C / 64G | z1d.2xlarge |
Comparison
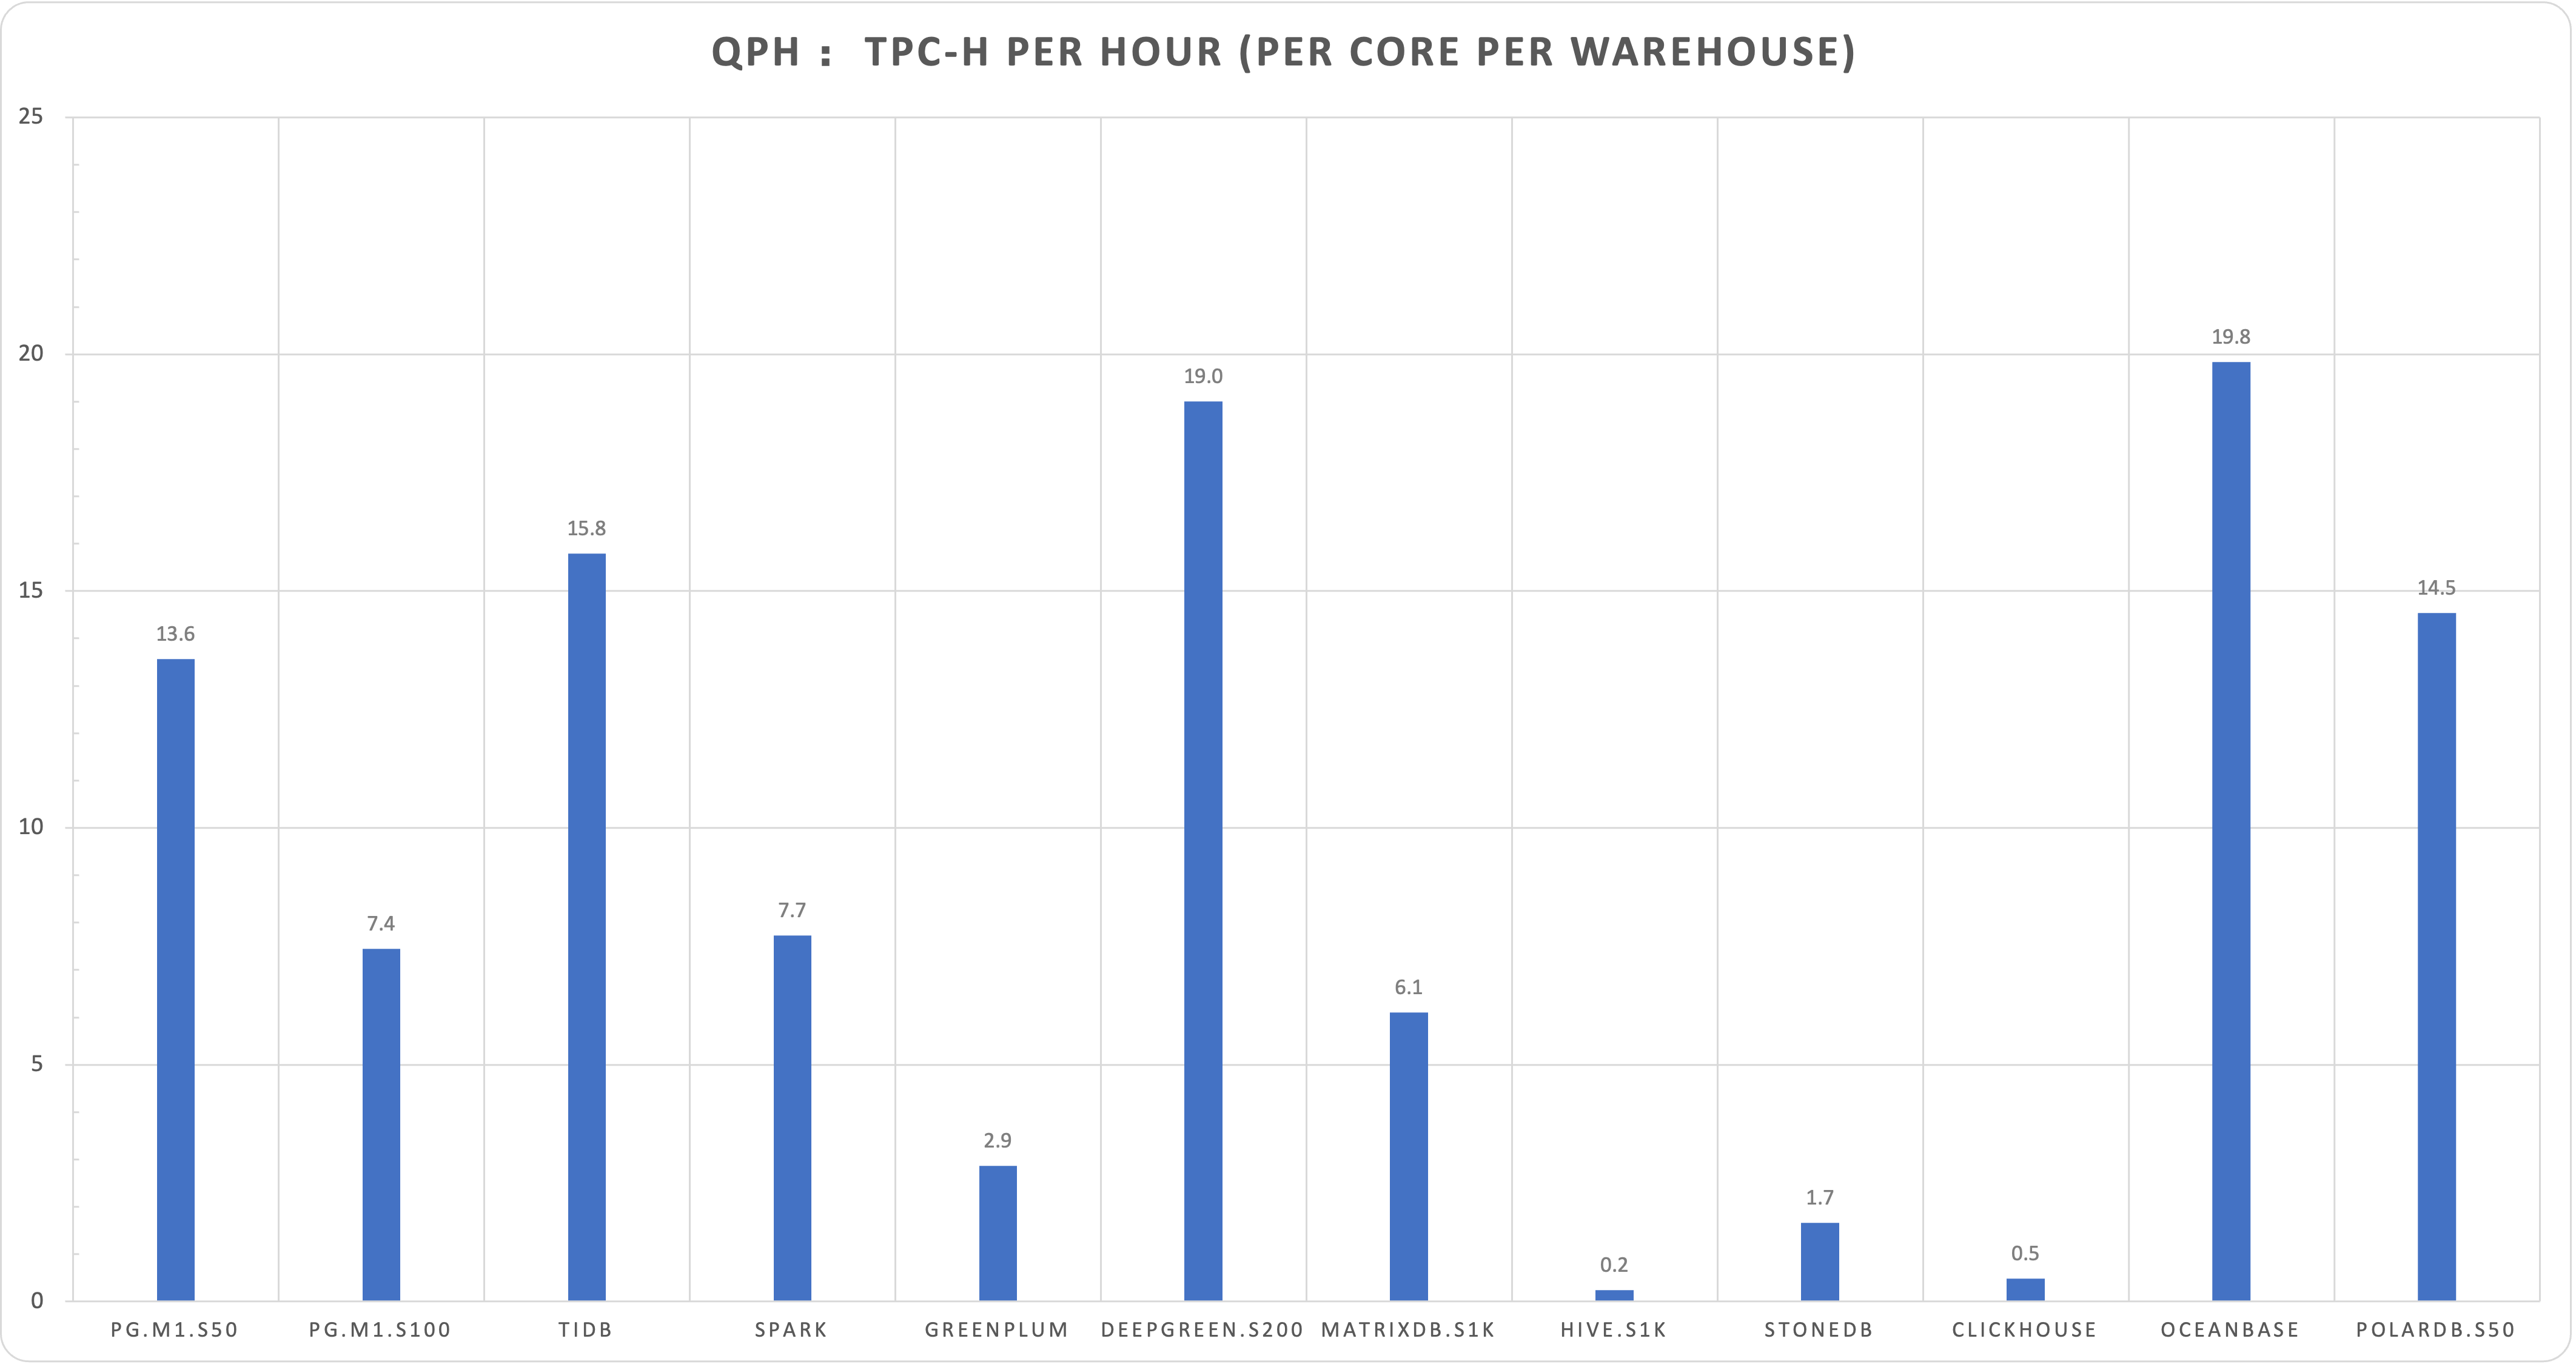
We can measure relative AP effectiveness by normalize CPU core numbers, Scale Factors. Just for a rough references: Effect = Estimated TPC-H Time spent completing 1 Warehouse using 1 Core.
QPH = ( 1 / time ) * ( scale_factor / core ) * 3600
| Database | SF | Time (s) | CPU | Environment | Comment | Source | Effect |
|---|
| PostgreSQL | 1 | 8 | 10 | 10C / 64G | apple m1 max | Vonng | 80 |
| PostgreSQL | 10 | 56 | 10 | 10C / 64G | apple m1 max | Vonng | 56 |
| PostgreSQL | 50 | 1327 | 10 | 10C / 64G | apple m1 max | Vonng | 265 |
| PostgreSQL | 100 | 4835 | 10 | 10C / 64G | apple m1 max | Vonng | 484 |
| PostgreSQL | 1 | 13.51 | 8 | 8C / 64G | z1d.2xlarge | Vonng | 108 |
| PostgreSQL | 10 | 133.35 | 8 | 8C / 64G | z1d.2xlarge | Vonng | 107 |
| TiDB | 100 | 190 | 120 | 120C / 570G | | TiDB | 228 |
| Spark | 100 | 388 | 120 | 120C / 570G | | TiDB | 466 |
| Greenplum | 100 | 436 | 288 | 120C / 570G | | TiDB | 1256 |
| DeepGreen | 200 | 148 | 256 | 288C / 1152G | | Digoal | 189 |
| MatrixDB | 1000 | 2306 | 256 | 256C / 1024G | | MXDB | 590 |
| Hive | 1000 | 59599 | 256 | 256C / 1024G | | MXDB | 15257 |
| StoneDB | 100 | 3388 | 64 | 64C / 128G | | StoneDB | 2168 |
| ClickHouse | 100 | 11537 | 64 | 64C / 128G | | StoneDB | 7384 |
| OceanBase | 100 | 189 | 96 | 96C / 384G | | OceanBase | 181 |
| PolarDB | 50 | 387 | 32 | 32C / 128G | | Aliyun | 248 |
| PolarDB | 50 | 755 | 16 | 16C / 64G | | Aliyun | 242 |
Reference
[12]: https://dl.acm.org/doi/10.1145/3514221.3526148 "Elena Milkai: "How Good is My HTAP System?",SIGMOD ’22 Session 25"
[13]: https://calculator.amazonaws.cn/ "AWS Calculator"
